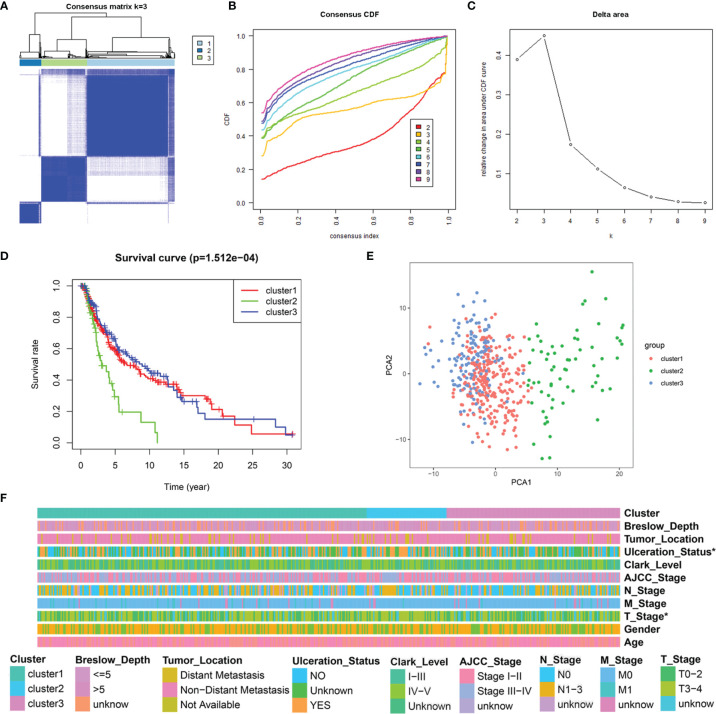
Figure 3.
Consensus clustering analysis of 184 LRGs. (A) Consensus clustering matrix at K = 3. (B) The CDF curves for clusters at k = 2 to 9. (C) The relative change in area under CDF curves for different clusters from k = 2 to 9. (D) Survival analysis for SKCM samples is stratified to the three clusters. (E) PCA plot for the three clusters. (F) Heatmap and the clinical parameters of the three clusters. * P < 0.05.

