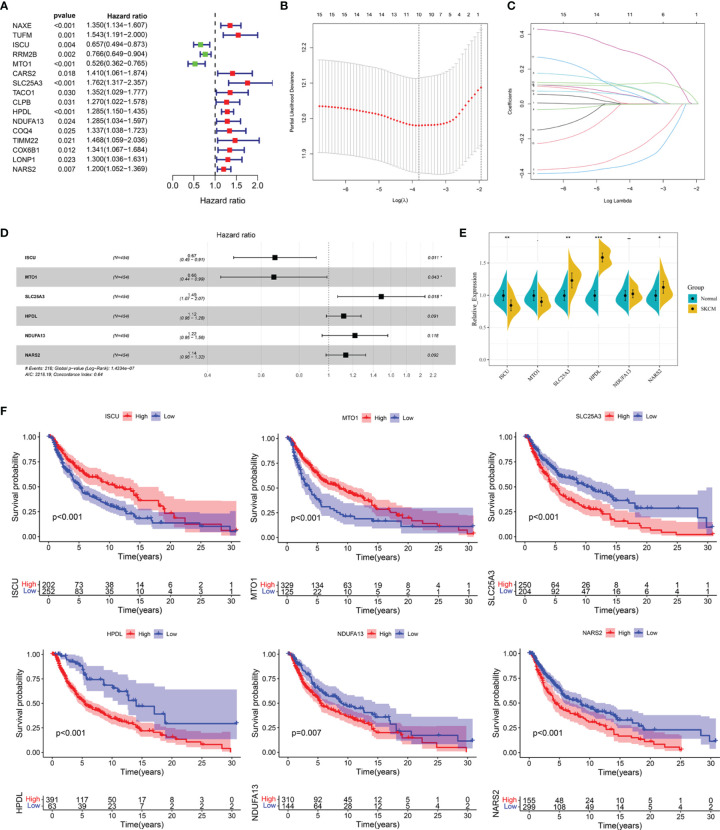
Figure 4.
Construction of the LRG prognostic signature in TCGA cohort. (A) Identification of the prognosis-related differentially expressed LRGs by univariate Cox regression analysis. (B, C) LASSO Cox regression analysis of 16 prognosis-related differentially expressed LRGs. (D) Forest plot of the six target genes that compose the LRG signature. (E) The expression levels of six target genes by qRT-PCR. (F) The Kaplan Meier analysis of the six target genes *P < 0.05; **P < 0.01;***P < 0.001.

