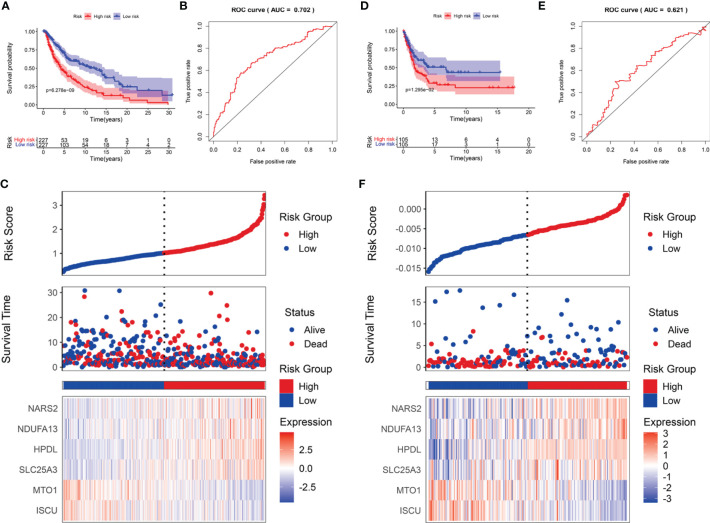
Figure 5.
The prognostic value of the LRG signature for SKCM patients. The survival analysis in TCGA cohort (A) and GSE54467 cohort (D). ROC curves indicated the predictive efficiency of the prognostic signature in TCGA cohort (B) and GSE54467 cohort (E). The risk score distribution, survival status, and heatmap for the expressions of the six genes in TCGA cohort (C) and GSE54467 cohort (F).

