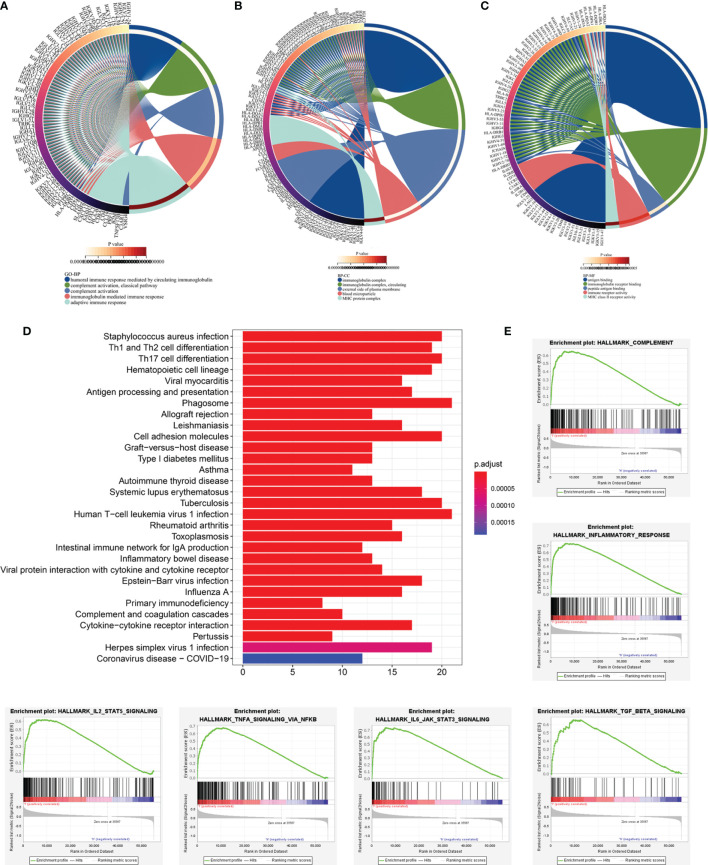
Figure 8.
Functional enrichment analyses of DEGs between low‐and high-risk subgroups based on LRG signature. Go annotation terms of DEGs between low‐and high-risk subgroups for biological process (A), cellular components (B), and molecular functions (C). (D) KEGG enrichment analysis for DEGs between low‐and high-risk subgroups. (E) GSEA findings.

