
Figure 3.
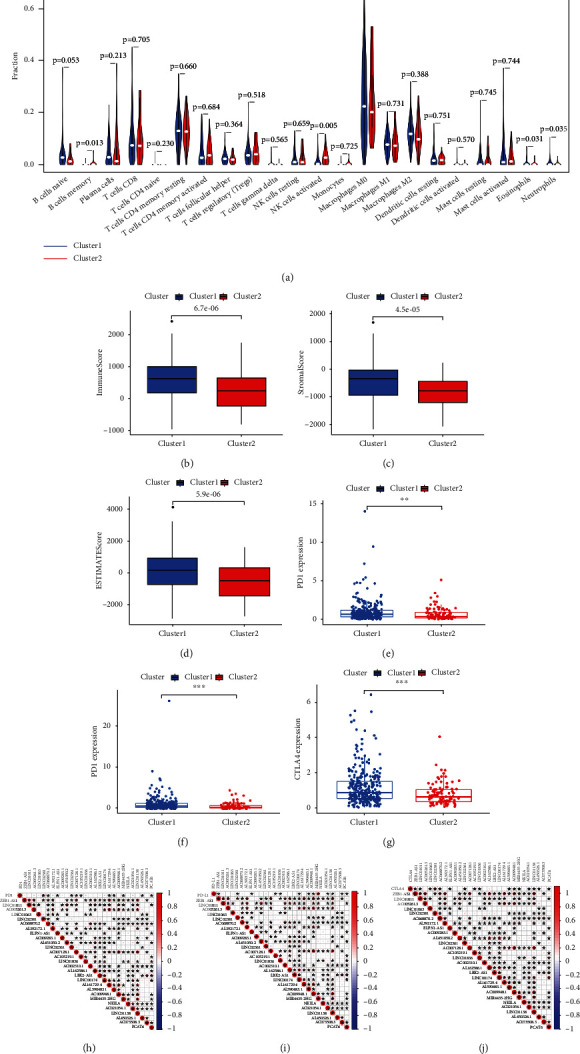
Distinct immune cell infiltration in two clusters and association of immune checkpoint inhibitors in colon cancer. (a) Infiltration levels of 22 immune cell types in clusters 1 and 2, (b) immunoscores in clusters 1 and 2, (c) stromal scores in clusters 1 and 2, (d) estimated scores in clusters 1 and 2, (e) PD1 expression levels in clusters 1 and 2, (f) PDL1 expression levels in clusters 1 and 2, (g) CTLA4 expression levels in clusters 1 and 2, (h) correlation between PD1 expression level and differential expression of ferroptosis-related lncRNAs, (i) correlation between PDL1 expression level and differential expression of ferroptosis-related lncRNAs, and (j) correlation between CTLA4 expression level and differential expression of ferroptosis-related lncRNAs, ∗∗p < 0.01 and ∗∗∗p < 0.001.