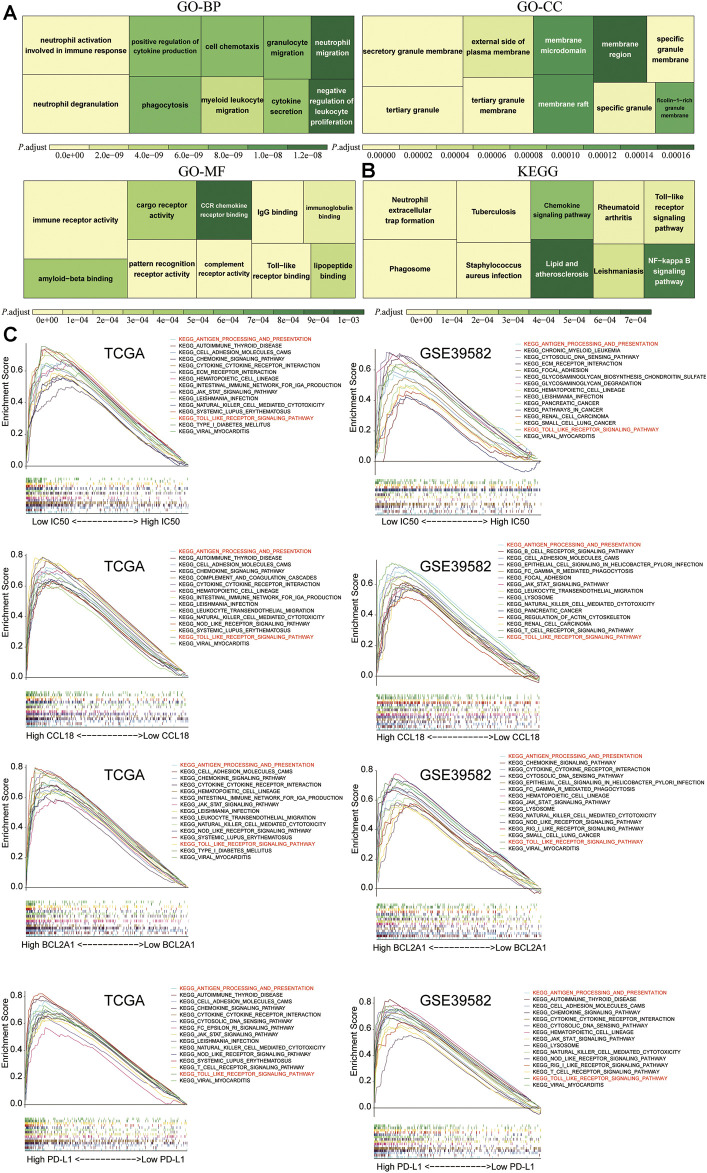
FIGURE 13.
The functional enrichment analysis and GSEA. The (A) GO and (B) KEGG analysis of 80 genes significantly related to CCL18 and BCL2A1 (Spearman’s correlation coefficient >0.6) in TCGA and GSE39582. (C) In TCGA and GSE39582, between the high and low groups of IC50, CCL18, BCL2A1, and PD-L1, among 186 KEGG pathways, there were two shared significant enrichment pathways, which are marked in red.

