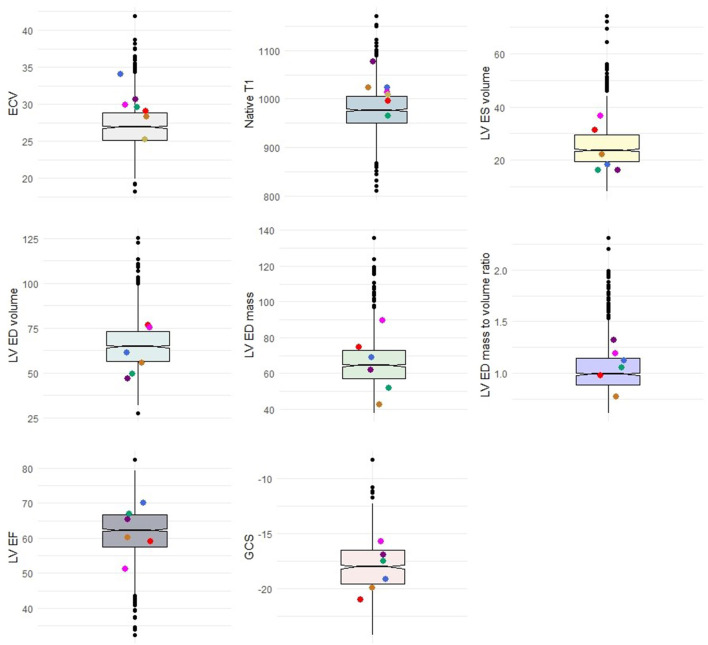
Figure 2.
Distribution of cases with P/LP variants or VUS+ (colored dots) in comparison with the total population. Colored dots represent cases. Box plots represent the range of data within the 1st to 3rd quartile of variables with relation to the median in notches. ECV, Extracellular volume; LV, Left ventricle; ES, End-systolic; ED, End-diastolic; EF, Ejection fraction; GCS, Global circumferential strain.

