FIGURE 1.
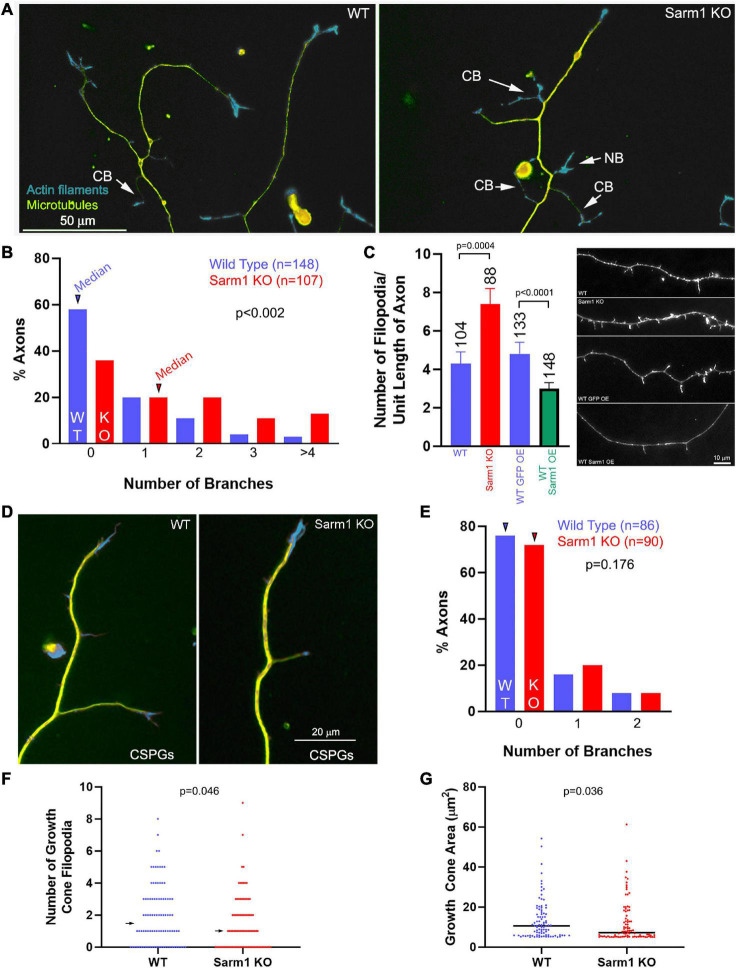
Axons of cultured SARM1 KO neurons exhibit increased branching. (A) Examples of axons of cultured dissociated wild-type (WT) and SARM1 knockout (KO) sensory neurons stained to reveal the actin filament (rhodamine phalloidin) and microtubule (anti-α-tubulin antibody) cytoskeleton. CB = collateral branches defined by the presence of a microtubule array and polarized distal actin filaments. NB = a nascent branch that is developing a distal growth cone. (B) Histogram showing the distribution of branch number along the axons of WT and SARM1 KO axons. Arrowheads denote the medians. (C) Graph showing the number of filopodia along the axons of WT and SARM1 KO (two leftmost bars) and those of WT expressing mitochondrially targeted GFP and overexpressing GFP-SARM1 (two rightmost bars). Representative examples of axonal morphology are shown on the right of the graph (phalloidin staining revealing actin filaments). (D) Examples of WT and SARM1 KO neuron distal axons cultured on CSPG substrata. (E) Histogram showing the distribution of branch number along the axons of WT and SARM1 KO axons cultured on CSPGs. Arrowheads denote the medians. (F) Number of filopodia in the growth cones of WT and SARM1 KO neurons. Arrows denote medians. (G) Measurement of the area of WT and SARM1 KO neuron growth cones. Black bars denote medians. A measurement of 5–6 μm2 reflects a growth cone with no lamellipodia, and the area is representative of the distal axon as specified in “Materials and Methods” section.

