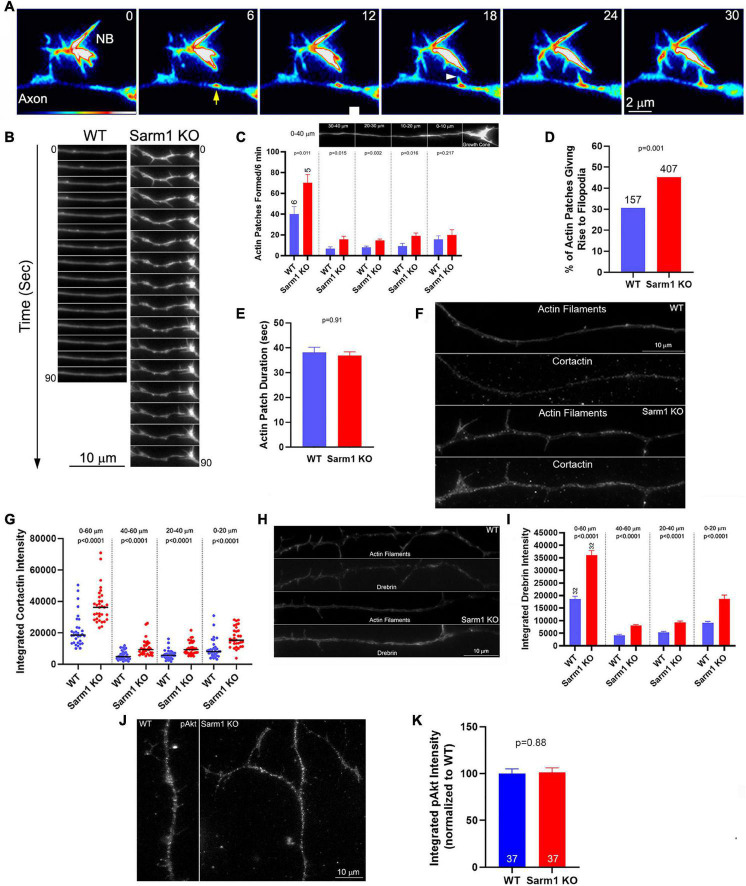
FIGURE 4.
Axons of SARM1 KO neurons exhibit increased rates of actin patch formation and emergence of filopodia. (A) Example of actin patch formation and emergence of a filopodium from an actin patch as imaged using mCherry-β-actin. The axon segment (SARM1 KO) contains a nascent branch (NB) (numbers in panels denote seconds). At 6 s, an actin patch forms (yellow arrow). At 18 s, a filopodium emerges from the actin patch (white arrowhead) and subsequently elongates. (B) Qualitative examples of axonal actin dynamics along WT and SARM1 KO. The axons of SARM1 KO neurons exhibited more frequent fluctuations at local levels of actin filaments and formation of filopodia. (C) Quantification of the rate of actin patch formation along axons. Leftmost bars show the rates along the distal 0–40 μm of the axon (0 defined as the point along the axon just proximal to the base of the growth cone (see image of the axon in the panel). Analysis of the rate of patch formation along the distal 0–40 μm divided into 10 μm bins is shown in the four rightmost sets of bar graphs. n = number of axons. (D) Proportion of axonal actin patches that give rise to filopodia is elevated in SARM1 KO neurons relative to WT. (E) Duration of actin patches does not differ between SARM1 KO and WT axons. (F) Examples of cortactin staining levels along distal WT and SARM1 axons. (G) Graph showing the quantification of cortactin along distal axons in the format initially shown in (C). Black bars denoted medians. (H) Examples of drebrin staining levels along distal WT and SARM1 axons. (I) Graph showing the quantification of drebrin along distal axons. (J) Examples of axons stained with antibodies to Akt phosphorylated at T308 (pAkt). (K) Quantification of the integrated intensity of pAkt staining along axons.

