Figure 1.
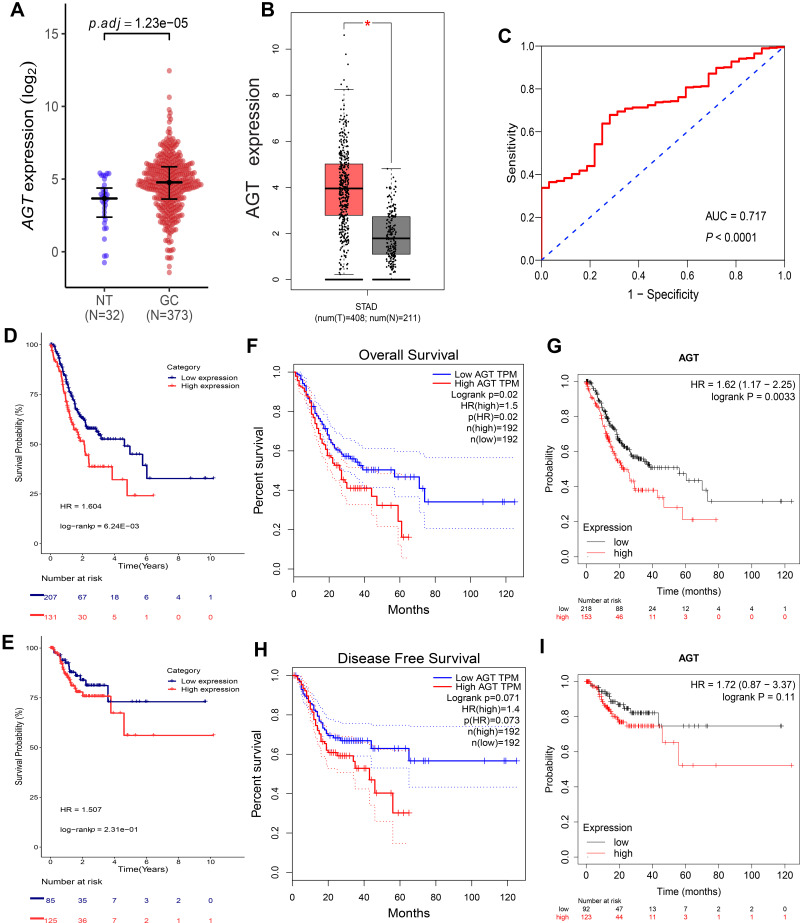
AGT expression in GC tissues and normal tissues based on TCGA database (A) and GEPIA database (B). The diagnostic value of AGT in GC using ROC curve (C). Correlation between AGT expression level and OS (D) and RFS/DFS (E) in GC based on TCGA dataset. Correlation between AGT expression and OS in GC based on GEPIA database (F), Kaplan-Meier Plotter (G); Correlation between AGT expression and RFS/DFS based on GEPIA database (H), Kaplan-Meier Plotter (I).
Notes: P-value Significant Codes: *Stands for P<0.05.
Abbreviations: P.adj, adjusted P; NT, normal tissue; GC, gastric cancer; STAD, stomach adenocarcinoma; AUC, the area under the receiver operating characteristic curve; HR, hazard ratio.

