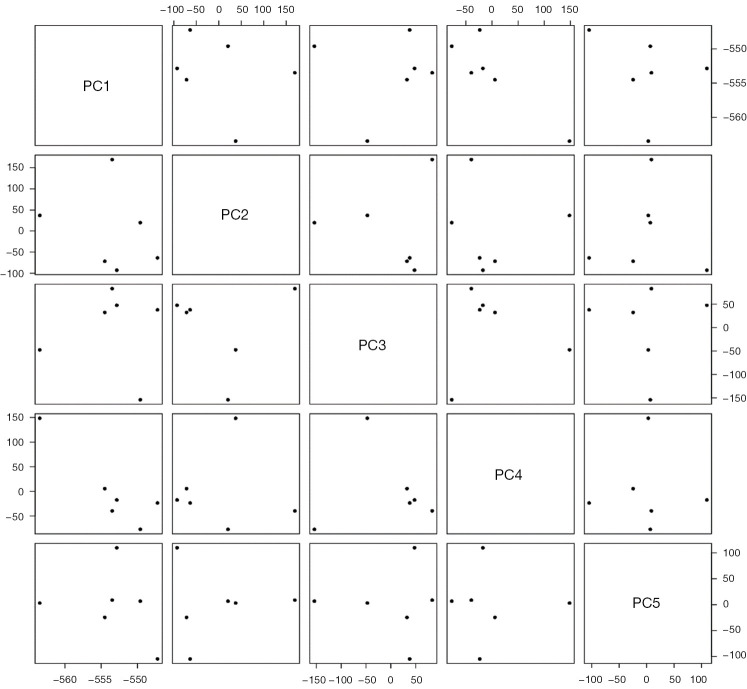
Figure 1.
PCA scoreplots for the first five PC, using all expressed genes. Analyses were performed using zero-centred RPKM logarithmic values. The six samples did not cluster in any of the scoreplots. The variances from PC1 to PC5 were 92%, 2.4%, 1.9%, 1.5%, and 1.2%, respectively. PC, principal component; PCA, principal component analysis; RPKM, Reads Per Kilobase of transcript per Million mapped reads.

