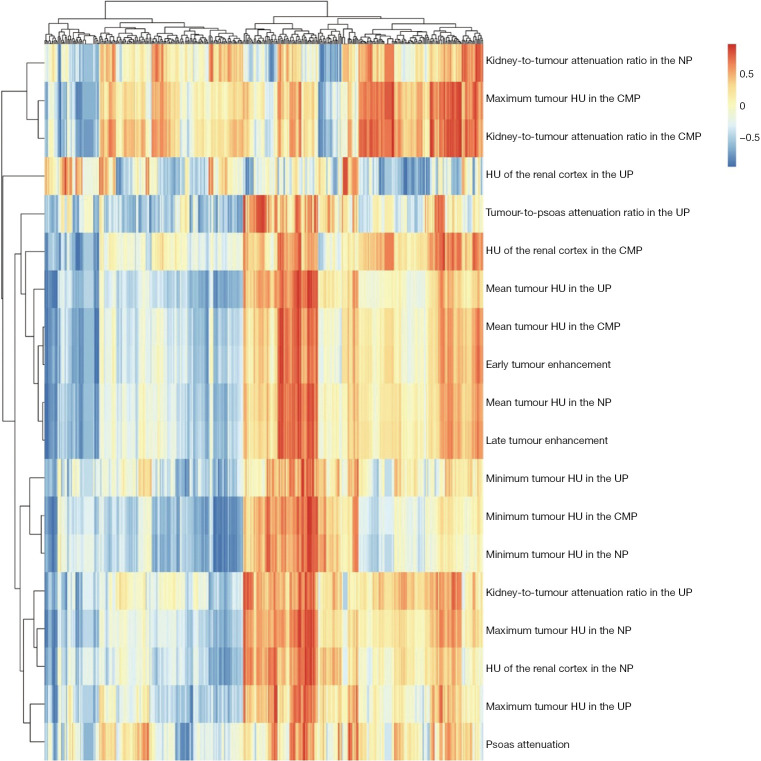
Figure 3.
Heatmap showing the correlation between expressed genes and 19 radiomic features. Correlation strength is shown from red to blue, ranging from complete positive to complete negative correlation on the base of Pearson’s correlation coefficients. HU, Hounsfield unit; UP, unenhanced phase; CMP, corticomedullary phase; NP, nephrographic phase.

