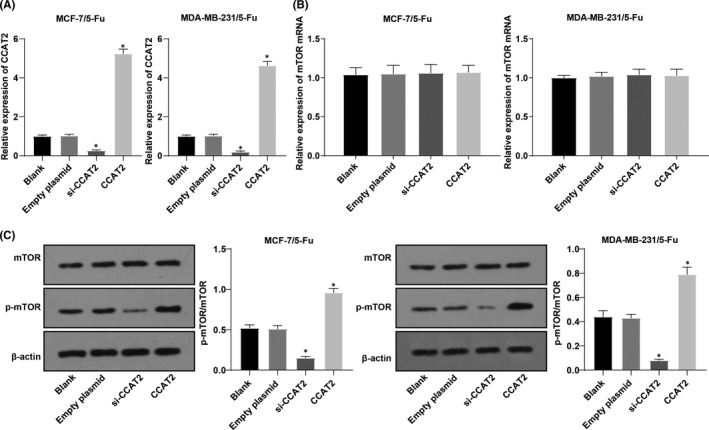
FIGURE. 2.

mTOR pathway activity in drug‐resistant cells decreased after CCAT2 inhibition in BC. Note: A, the mRNA level of CCAT2 was detected by RT‐qPCR; B, mRNA expression of mTOR in MCF‐7/5‐Fu cell and MDA‐MB‐231/5‐Fu cell detected by RT‐qPCR; C, Western blot analysis was used to detect expression of mTOR and p‐mTOR. The measurement data were expressed as mean ±standard deviation. One‐way ANOVA was used for comparisons. Tukey's multiple comparisons test was used for the post hoc test. Compared with the blank group, * p < 0.05
