
FIGURE 2.
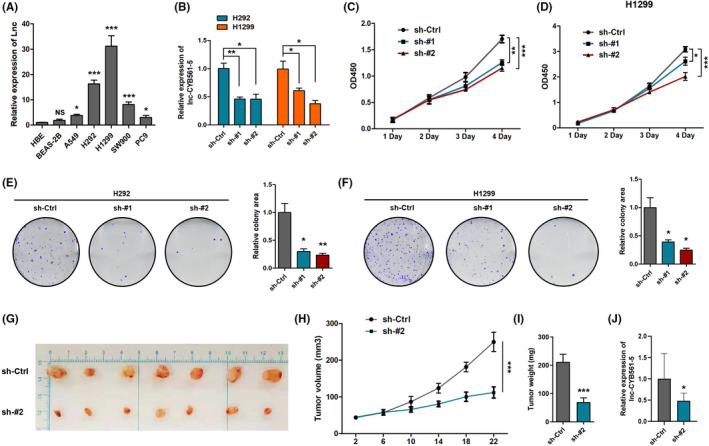
Lnc‐CYB561‐5 facilitates NSCLC cell proliferation in vitro. (A) The expression level of lnc‐CYB561‐5 was detected by qRT‐PCR in HBE, BEAS‐2B and NSCLC cell lines (A549, H1299, H292, SW900 and PC9), *p < 0.05, ***p < 0.001, NS, p > 0.05 vs the HBE cells. (B) Knockdown of lnc‐CYB561‐5 was confirmed in H1299 and H292 cells by qRT‐PCR, *p < 0.05, **p < 0.01 vs the indicated group. (C and D) CCK‐8 assay analysis of cell proliferation in H1299 and H292 cells, *p < 0.05, **p < 0.01, ***p < 0.001 vs. the indicated group. (E and F) Colony formation assays in H1299 and H292 cells, *p < 0.05, **p < 0.01 vs. the sh‐Ctrl group, n = 5. (G–I) Photographs of matrigel plugs excised from mice after 22 days of growth in vivo and quantitative analysis of the tumour volume and tumour weight, ***p < 0.001 vs. the sh‐Ctrl group, n = 7. (J) Detection of lnc‐CYB561‐5 expression in xenograft models by qRT‐PCR, *p < 0.05, n = 3. Data are presented as means ± SEM. Multiple group comparisons were performed using one‐way ANOVA followed by Tukey's post hoc test. Two‐group comparisons were performed using unpaired t‐test