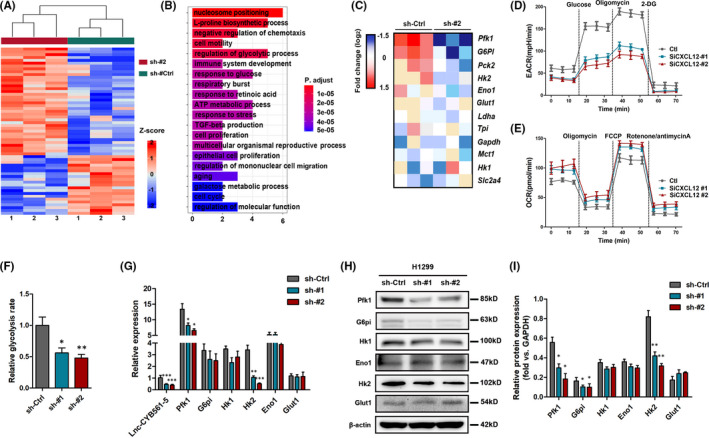
FIGURE 4.

Lnc‐CYB561‐5 promotes aerobic glycolysis in vivo. (A) Cluster analysis of differentially expressed mRNAs in H1299 cells treated with the lnc‐CYB561‐5 knockdown. (B) The top 20 GO enrichment of significantly upregulated genes (fold change > 2, p < 0.05, top 100). (C) Heatmap depicting relative expression of known genes related to glycolysis. (D and E) Measurement of ECARO and CR in H1299 cells treated with the lnc‐CYB561‐5 knockdown. (F) Relative glycolysis rates in H1299 cells, as judged by Seahorse analyses. (G–I) Relative mRNA and protein expression levels of Pfk1, Hk1, Hk2, Eno1, G6pi and Glut1 in H1299 cells. *p < 0.05, **p < 0.01, ***p < 0.001, NS, p > 0.05 vs. the sh‐Ctrl group, n = 5. Data are presented as means ± SEM. Multiple group comparisons were performed using one‐way ANOVA followed by Tukey's post hoc test
