Figure 1.
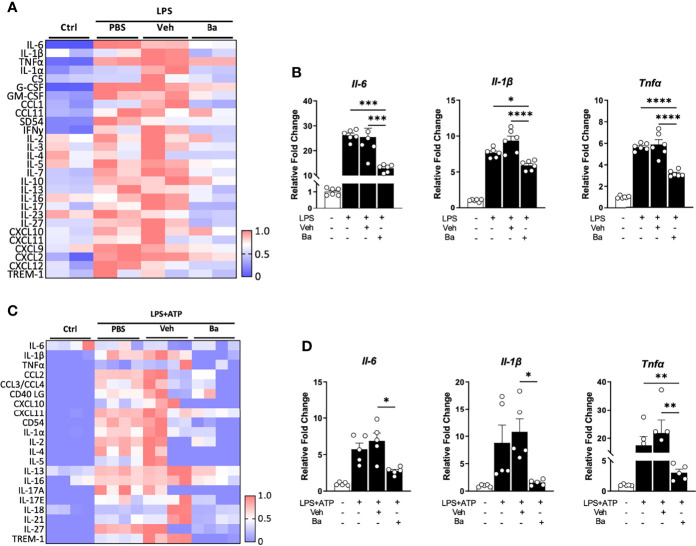
Baicalein suppresses the activation of both human and mouse microglia. (A) Heatmap showing the quantification of cytokine expression in the supernatants of BV2 microglial cultures that received no treatment (Ctrl) or treatment with lipopolysaccharide (LPS) followed by PBS, vehicle control (Veh), or baicalein (Ba). The scale bar (0–1) of the heatmaps represents the raw pixel intensities normalized to the maximum intensity for each cytokine. (B) qPCR results showing the relative expression of pro-inflammatory cytokines in LPS-stimulated BV2 cells followed by Veh or Ba treatment. N = 6/group. Relative fold changes of genes were normalized to naive control group. (C) Heatmap showing the quantification results of cytokine protein expression from the supernatants of HMC3 cultures that received no treatment (Ctrl) or treatment with LPS+ATP plus PBS, vehicle (Veh), or baicalein (Ba). (D) qPCR results showing the relative expression of pro-inflammatory cytokines in LPS and ATP-stimulated HMC3 cells followed by vehicle (Veh) or baicalein (Ba) treatment. N = 5/group. Relative fold change of genes was normalized to naive control group. Data were presented as mean ± SEM. Each dot represented individual replicate. *P < 0.05, **P < 0.01, ***P < 0.001, ****P < 0.0001, one-way ANOVA with Tukey’s multiple comparisons test.

