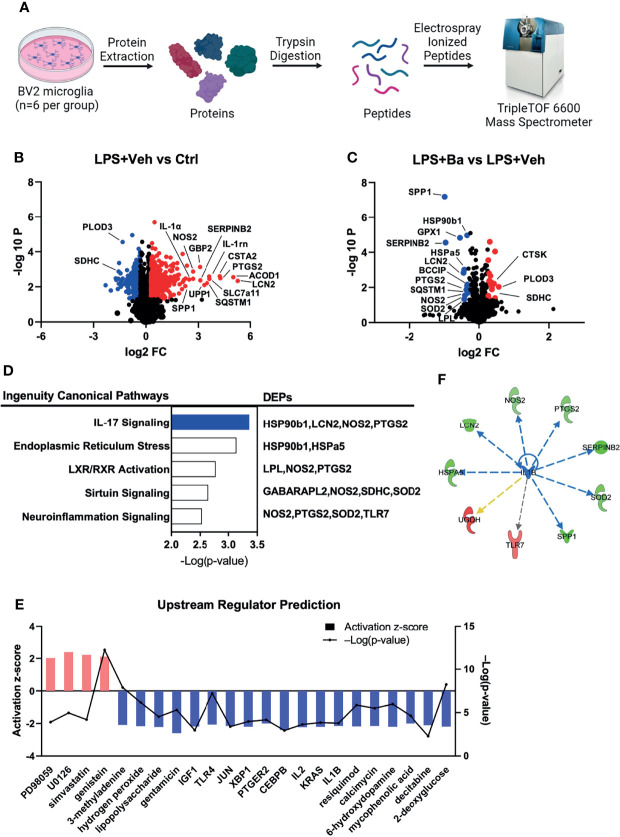
Figure 3.
Proteomic analysis further reveals IL-17 signaling and upstream regulator of IL-1β inhibited by baicalein on LPS-primed microglia. (A) Graphic illustration of the design of proteomics study. The illustration was created with BioRender. Volcano plot showing the differentially expressed proteins (DEPs) in the groups of (B) LPS + Veh vs. Ctrl and (C) LPS + Ba vs. LPS + Veh. Red dots represent the upregulated DEPs (P-value < 0.05 and FC > 1.2) and blue dots are the downregulated DEPs (P-value < 0.05 and FC ≥ 1.2). (D) Top 5 canonical pathways (left) enriched by IPA analysis of involved DEPs (right) in BV2 cells (LPS + Ba vs. LPS + Veh). Bar chart was presented with the log-transformed P-value, representing the top disease-related biological pathways and involved proteins in each pathway. Blue and white bars represented z-score = −2 and 0, respectively. (E) Upstream regulator predication by IPA; bar represented the activation z-score, and the line chart represented –Log(P-value). (F) Representative network showed the interaction between the upstream regulator IL-1β and its downstream molecules. Red and green colors represented increased and decreased measurement in the samples. Blue, yellow, and gray lines with arrow represented inhibition, findings inconsistent with state of downstream molecule, and effect not predicted, respectively. N = 6 biological samples.

