FIGURE 1.
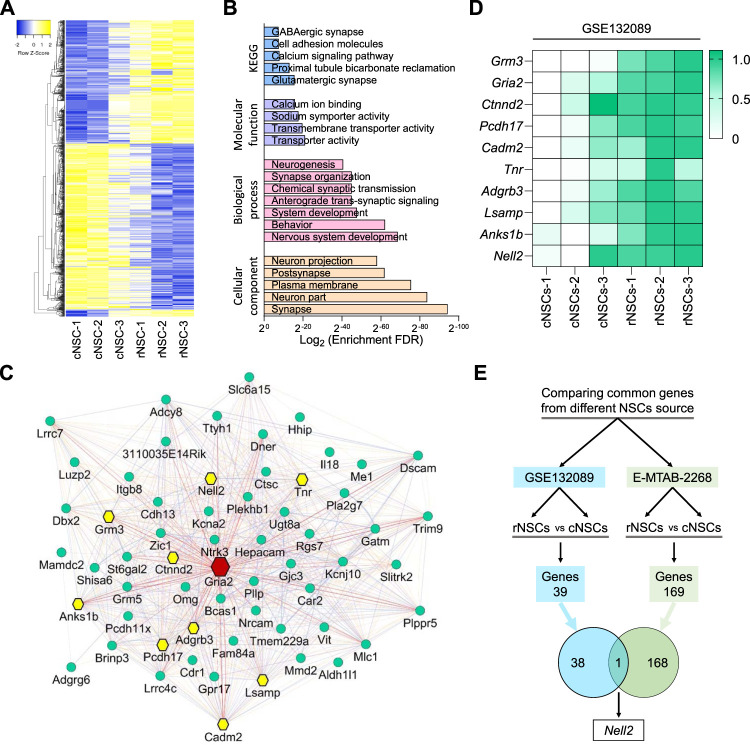
Microarray and network hub gene analysis of differentially expressed genes in the developing mouse central nervous system. (A) Heatmaps of differentially expressed genes in rostral compared to the caudal neural stem cells (NSCs). rNSCs, rostral NSCs; cNSCs, caudal NSCs. (B) Bar graphs showing KEGG (blue), molecular function (purple), biological process (pink), and cellular component (light orange) enrichment analysis of upregulated genes in rostral NSCs compared to caudal NSCs. (C) Network plot of top 20% genes enriched in rostral NSCs; the node in red is the main hub gene with degree = 68, nodes in yellow are hub genes with degree of ≥50, and nodes in green are genes of a degree ≤50. Interactive network is generated using GeneMANIA plugin in Cytoscape, and interactions between genes are generated based on co-expression, co-localization, physical interactions, shared protein domains, and genetic interactions. (D) Heatmap representing the expression of microarray data of mouse hub genes in caudal and rostral NSCs from a published dataset (GSE132089) (Shaker M. R. et al., 2020). Relative expression data was further normalized between 0 (lowest) and 1 (highest) expression value of individual genes across datasets. Normalized expression values were color-coded with green values indicating upregulation and white values indicating downregulation. rNSCs, rostral NSCs; cNSCs, caudal NSCs. (E) Venn diagram showing the overlap of upregulated gene (Nell2) in NSCs derived from mouse ESCs in vitro [green, E-MTAB-2268 (Gouti et al., 2014)] and in mouse in vivo primary embryonic NSCs [blue, GSE132089 (Shaker M. R. et al., 2020)].

