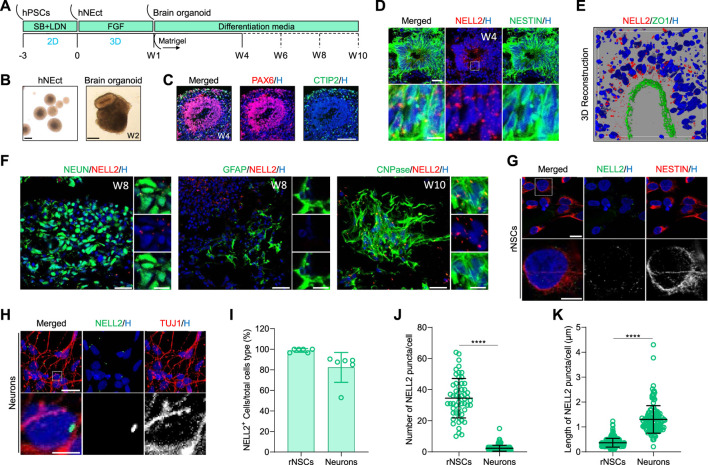
FIGURE 3.
Analysis of NELL2 expression patterns in neural cells of human brain organoids. (A) Schematic representation of the strategy used to generate human cortical brain organoids from WTC iPSCs. hNEct, human neuroectodermal; W, week; D, day. (B) Representative images of human neuroectodermal spheroids after 4 days of FGF treatments and cortical brain organoids at 2 weeks of differentiation. Scale bar = 200 μm. (C) Representative images of sections of 4-week-old brain organoids derived from human WTC iPSCs, immunostained for ventricle zone PAX6 (red) and cortical plate CTIP2 (green). All sections were counterstained with Hoechst 33342 (blue). Scale bar = 120 μm. (D) Representative images of 4-week-old cortical brain organoid sections immunostained for NESTIN (green) and NELL2 (red). All sections were counterstained with Hoechst 33342 (blue). Scale bar = 30 μm; zoomed images’ scale bar = 10 μm. Dotted box indicates the magnified region. (E) Representative image of 3D reconstruction immunostained sectioned neural rosettes in organoids at 4 weeks old for ZO1 (green) and NELL2 (red). The section was counterstained with Hoechst 33342 (blue). (F) Representative images of cortical brain organoid sections immunostained for NEUN (green), GFAP (green), CNPase (green), and NELL2 (red). All sections were counterstained with Hoechst 33342 (blue). Scale bar = 30 μm; zoomed images’ scale bar = 10 μm. (G) Representative images of rostral neural stem cells derived from human WTC iPSCs. Rostral neural stem cells stained with NESTIN (red) and NELL2 (green). Scale bar = 16 μm. All nuclei were counterstained with Hoechst 33342 (blue). Dotted box indicates the magnified area. (H) Representative images of neurons derived from human WTC iPSCs. Rostral neural stem cells stained with TUJ1 (red) and NELL2 (green). Scale bar = 20 μm; zoomed images’ scale bar = 5 μm. All nuclei were counterstained with Hoechst 33342 (blue). Dotted box indicates the magnified area. (I) Percentage of NELL2+ cells relative to the total number of NESTIN+ and TUJ1+ cells in rNSCs and neurons, respectively. Data are presented as mean ± standard deviation. Number of independent experiments = 6. (J) Quantification of the number of NELL2 puncta per cells in rostral neural stem cells and neurons of the data presented in panels (G,H). At least 223 cells were counted per three biological replicates. Data are presented as the mean ± standard deviation. ****p < 0.0001 via Student’s t-test. rNSCs, rostral NSCs. (K) Measurement of the length of NELL2 puncta per cell in rostral neural stem cells and neurons of data presented in (G,H). At least 223 cells were counted per three biological replicates. Data are presented as the mean ± standard deviation. ****p < 0.0001 via Student’s t-test. rNSCs, rostral NSCs.

