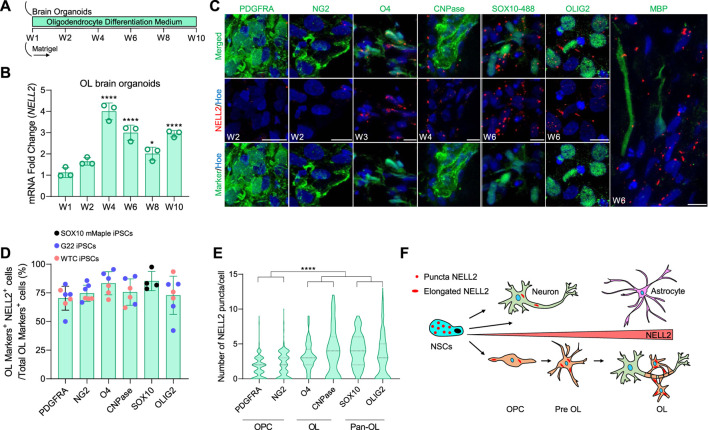
FIGURE 4.
Detailed analysis of NELL2 expression patterns across oligodendroglial cells in human OL brain organoids. (A) Schematic representation of the strategy used to generate human oligodendrocyte brain organoids from WTC iPSCs, G22 iPSCs, and SOX10 mMaple iPSCs. W, week. (B) qRT-PCR of NELL2 mRNA in human oligodendrocyte brain organoids. All values were normalized to GAPDH levels of their respective samples over week 1 to week 10 and expressed relative to week 1 to obtain the fold change. Data are shown as mean ± standard deviation; number of independent experiments = 3. *p < 0.05; ****p < 0.001 via one-way ANOVA. W, week; OL, oligodendrocyte. (C) Representative images of 2- and 3-week-old oligodendrocyte brain organoid sections immunostained for PDGFRA (green), NG2 (green), O4 (green), CNPase (green), OLIG2 (green), MBP (green), and NELL2 (red). For SOX10–488, week 6 oligodendrocyte brain organoids are derived from SOX10 mMaple iPSCs and stained with NELL2 (red). All sections were counterstained with Hoechst 33342 (blue). Scale bar = 10 μm. (D) Percentage of NELL2+ cells relative to the total number of PDGFRA+, NG2+, O4+, CNPase+, SOX10+, and OLIG2+ cells in oligodendrocyte brain organoids at week 2, week 3, week 4, and week 6. Data are presented as mean ± standard deviation. The minimum number of independent experiments = 4. Number of examined organoids = 36. (E) Quantification of the number of NELL2 puncta per cells in PDGFRA+, NG2+, O4+, cnpase+, SOX10+, and OLIG2+ cells in oligodendrocytes brain organoids at week 2, week 3, week 4, and week 6; data presented in panel (C). At least 400 cells were counted per minimum three biological replicates. Data are presented as the mean ± standard deviation. ****p < 0.0001 via one-way ANOVA. (F) Schematic diagram of puncta and elongated form of NELL2 distribution across human embryonic neural cells.

