FIGURE 5.
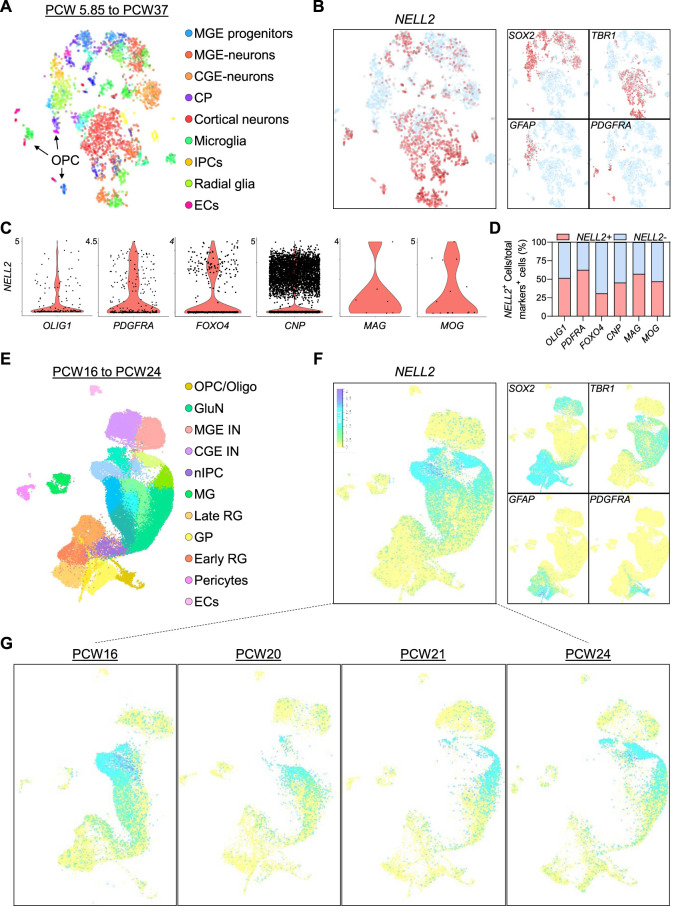
Transcriptome profiling of NELL2 in human fetal brain cells. (A) Two-dimensional tSNE plot of 4,261 cells colored by cluster of human fetal neural cells adopted from bit.ly/cortexSingleCell (Nowakowski et al., 2017). (B) The distribution of NELL2 expression across the fetal brain neural cell clusters identified in panel (A). (C) Violin plots showing the NELL2 expression across oligodendroglial cells markers including OLIG1, PDGFRA, FOXO4, CNP, MAG, and MOG across all clusters. The x-axis is the expression level. (D) Quantification of the percentage of NELL2+ cells relative to the total number of OLIG1+, PDGFRA+, FOXO4+, CNP+, MAG+, and MOG+ cells in oligodendrocyte human fetal brain. (E) UMAP plot of cells colored by cluster of human fetal neural cells adopted from bit.ly/cortexSingleCell (Trevino et al., 2021). RG, radial glia; OPC/Oligo, oligodendrocyte progenitor cell/oligodendrocyte; nIPC, neuronal intermediate progenitor cell; GluN, glutamatergic neuron; CGE IN, caudal ganglionic eminence interneuron; MGE IN, medial ganglionic eminence interneuron; EC, endothelial cell; MG, microglia. (F) The distribution of NELL2 expression across the fetal brain neural cell (Sox2+, TBR1+, GFAP+, and PDGFRA+ cells) clusters identified in panel (E). (G) The distribution of NELL2 expression across the fetal brain neural cells at different stages of brain development.

