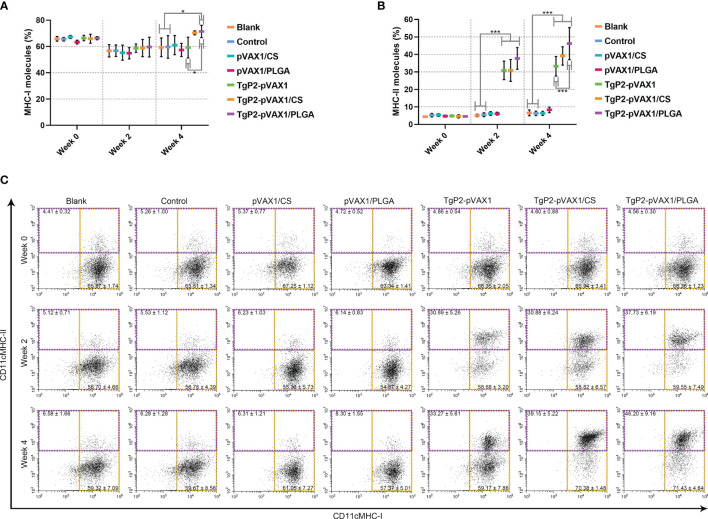
Figure 8.
Flow cytometry analysis of MHC molecules on the surface of dendritic cells (DCs). Five animals in each group were sacrificed, and spleen lymphocytes from each animal were investigated. The bar graph shows the ratio of MHC-I (A) and MHC-II molecules (B) on splenic DCs, while the dot plots (C) show the percentages of CD11c+ MHC-I+ and CD11c+ MHC-II+ cells. Values are shown as mean ± SD (n = 5), and significance was evaluated by one-way ANOVA followed by Dunnett’s test. Values among the TgP2-pVAX1, TgP2-pVAX1/PLGA, and TgP2-pVAX1/CS groups were pairwise compared by ANOVA following Bonferroni’s correction. *p < 0.05 and ***p < 0.001 compared with blank or control group.

