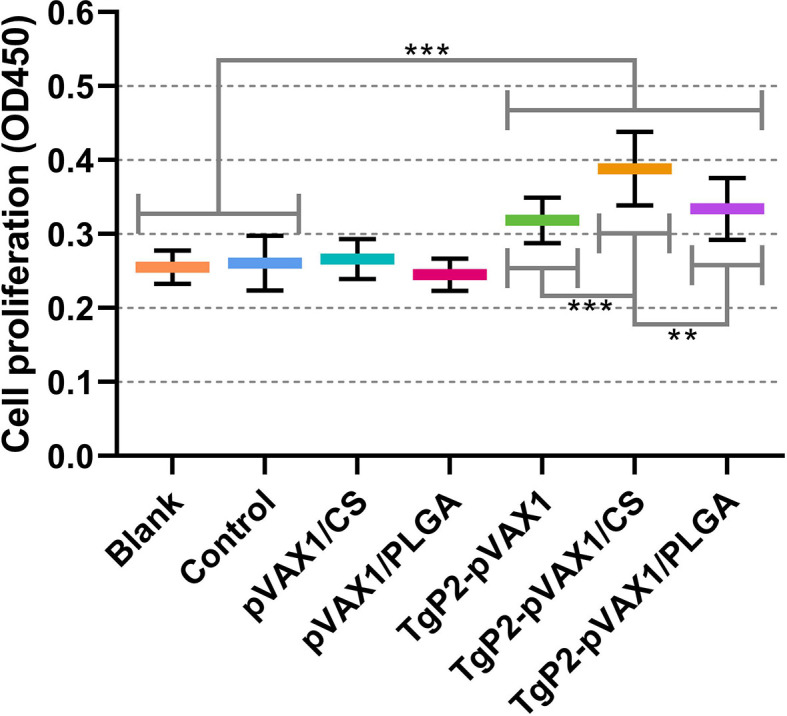
Figure 9.

Splenocyte proliferation of animals. Three mice in each group were sacrificed, and spleen lymphocytes from each animal were investigated (n = 3). The obtained lymphocytes from each animal were divided into four parts and incubated with the HEK 293-T cell lysates transfected with phosphate-buffered saline (PBS) (Blank group), pVAX1 (Control group), and TgP2-pVAX1 (TgP2-pVAX1, TgP2-pVAX1/PLGA, and TgP2-pVAX1/PLGA groups). Each reaction was conducted once, and significance was estimated by one-way ANOVA followed by Dunnett’s test. Values among the TgP2-pVAX1, TgP2-pVAX1/PLGA, and TgP2-pVAX1/CS groups were pairwise compared by ANOVA following Bonferroni’s correction. **p < 0.01 and ***p < 0.001 compared with blank or control group.
