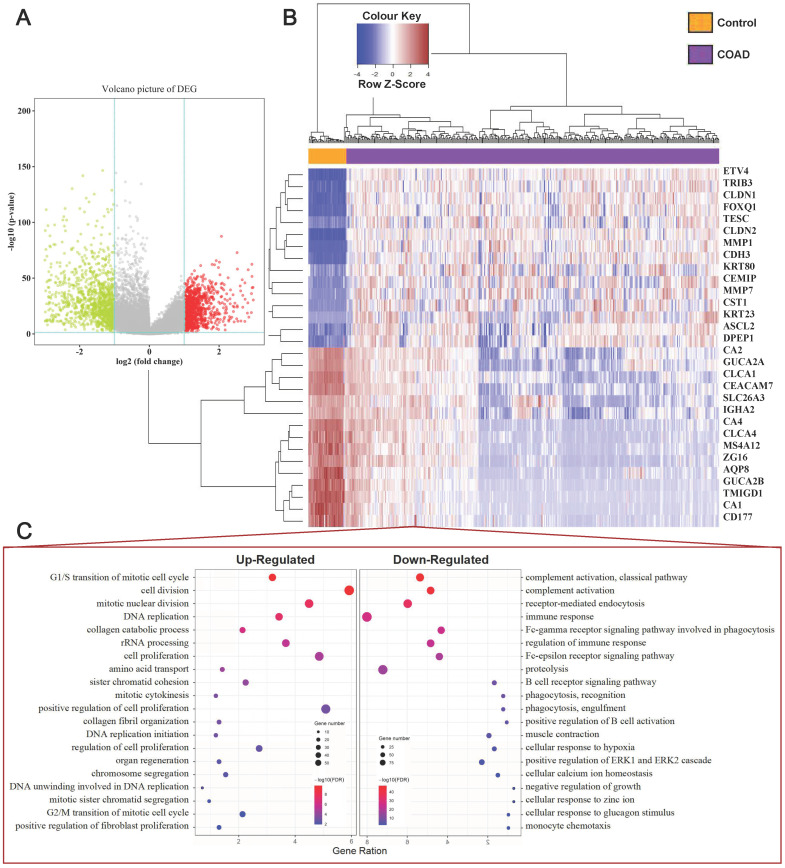
Figure 1.
Identification of DEGs in COAD Tissue Samples. (A) Volcano plot of DEGs with |fold change (FC)| > 2 and p-value of <0.05. Red nodes represent DEGs with FC > 2 and p-value of < 0.05; green nodes represent DEGs with FC < 2 and p-value of < 0.05. (B) A heat map of top 15 upregulated and top 15 downregulated DEGs. Each column represents a sample and each row represents one gene. The gradual color ranging from blue to red represents the gene expression changing from downregulation to upregulation. (C) The bubble plot shows the top 20 enriched biological processes (BP) of the upregulated genes and downregulated genes.

