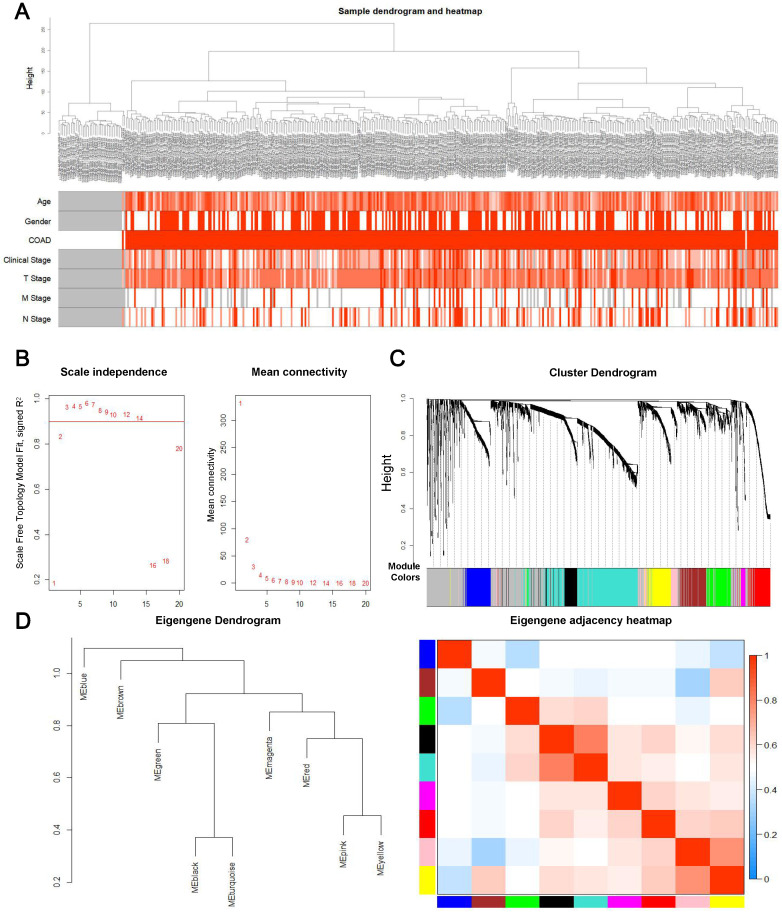
Figure 2.
Construction of the prognosis-associated genes co-expression network. (A) Clinical information from samples involved in constructing the gene co-expression network associated with the prognosis. (B) The left panel shows the scale-free fit index, signed Rˆ 2 (y-axis) and the soft threshold power (x-axis). β = 3 has been chosen for subsequent analysis. The right panel shows the mean connectivity (y-axis), which is a strictly decreasing function of the power β (x-axis). (C) Clustering dendrogram of genes. The color bands provide a simple visual comparison of module assignments based on the dynamic tree cutting method. (D) Clustering dendrogram (left) and heatmap of the correlation between module eigengenes (right).

