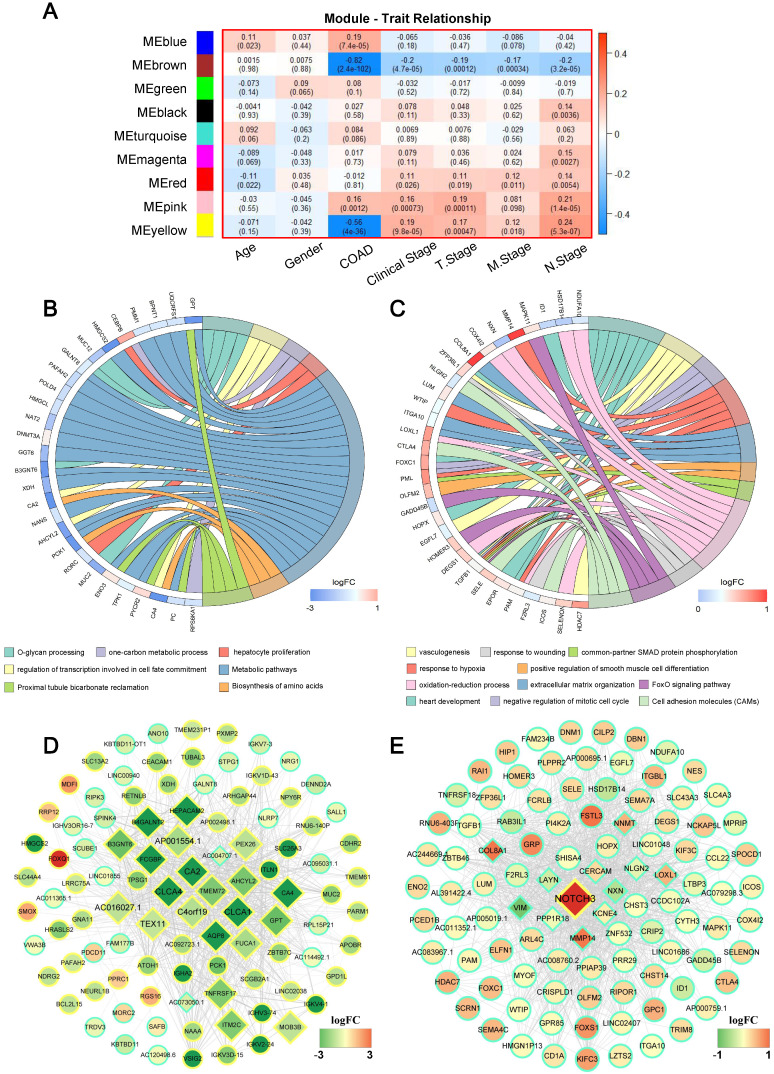
Figure 3.
Weighted gene correlation network analysis (WGCNA) identifies critical modules correlating with pathological parameters. (A) Correlation between modules and traits. The upper number in each cell refers to the correlation efficient of each module in the trait, and the lower number is the corresponding P value. Gene Ontology (GO) biological process (BP) terms in the enrichment analysis of genes in the turquoise (B) and brown module (C). (D) The hub genes of brown module with weights (w) above a threshold of 0.01. (E) The hub genes of pink module with weights (w) above a threshold of 0.05.

