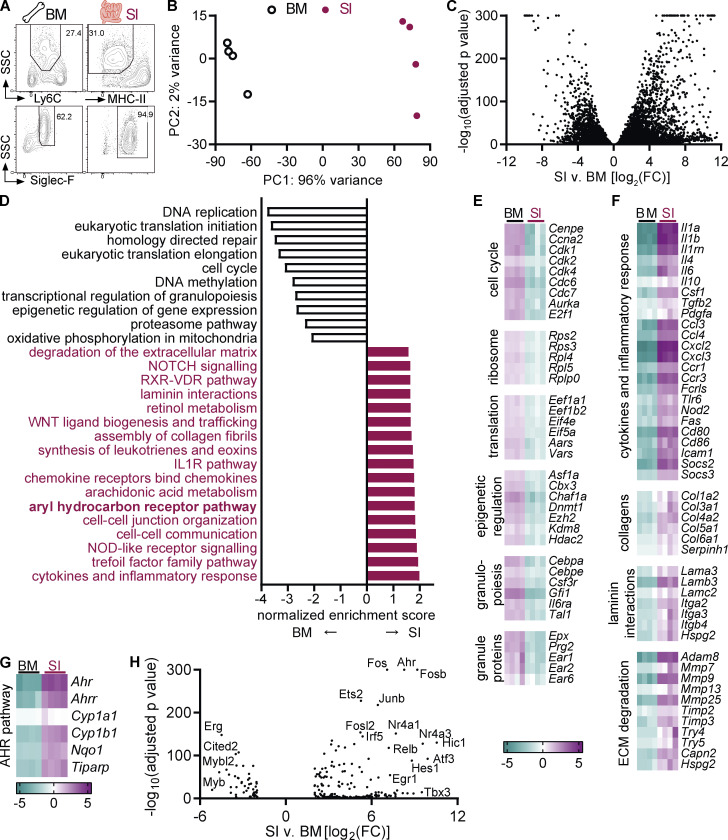
Figure 1.
Eosinophils undergo tissue adaptation in the small intestine. RNA sequencing was conducted on sorted eosinophils from the bone marrow and small intestine of n = 4 female mice each. (A) Eosinophils were sorted from the bone marrow and small intestine. Full gating strategy is depicted in Fig. S1, A–C. (B) Principal component analysis of RNA sequencing data. (C) Volcano plot of differentially expressed genes. For adjusted P values = 0, the value of 10–300 was assigned. (D) Canonical pathways enriched in eosinophils from the small intestine compared with bone marrow eosinophils were determined by GSEA. A selection of pathways with the highest enrichment scores are shown. (E–G) Examples of functionally defined gene subsets that are differentially expressed between small intestinal and bone marrow eosinophils (adjusted P value <0.05). Shown is the log2 fold change to the geometric mean of TPM + 1. (H) Volcano plot of differentially expressed transcription factors (|FC| > 4, adjusted P < 0.05). BM, bone marrow; SI, small intestine; TPM, transcripts per million.

