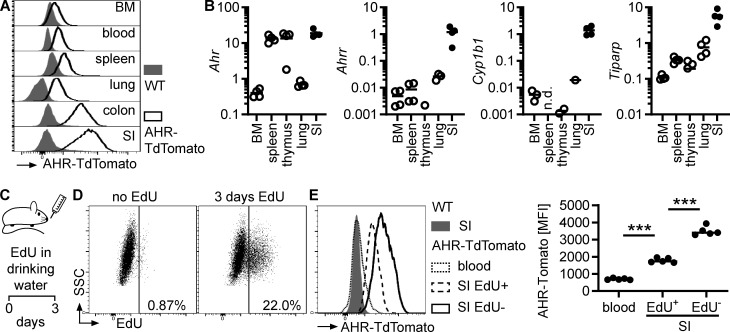
Figure 2.
AHR is induced in intestinal eosinophils. (A) AHR-TdTomato expression in eosinophils from different tissues was determined by flow cytometry. Histograms are representative of n = 4 AHR-TdTomato mice from two independent experiments. (B) Gene expression in eosinophils FACS-sorted from different tissues was determined by qPCR and normalized to Hprt. Data are representative of two independent experiments with n = 3–4 mice per tissue. Missing data points indicate RNA was not detectable by qPCR. (C–E) AHR-TdTomato mice were treated with EdU in drinking water for 3 d. AHR-TdTomato fluorescence in eosinophils from the blood and small intestine was quantified by flow cytometry. Data are representative of two independent experiments with n = 3–5 mice. One-way ANOVA; ***, P < 0.001. BM, bone marrow; MFI, mean fluorescence intensity; n.d., not detected; SI, small intestine.

