Figure 5.
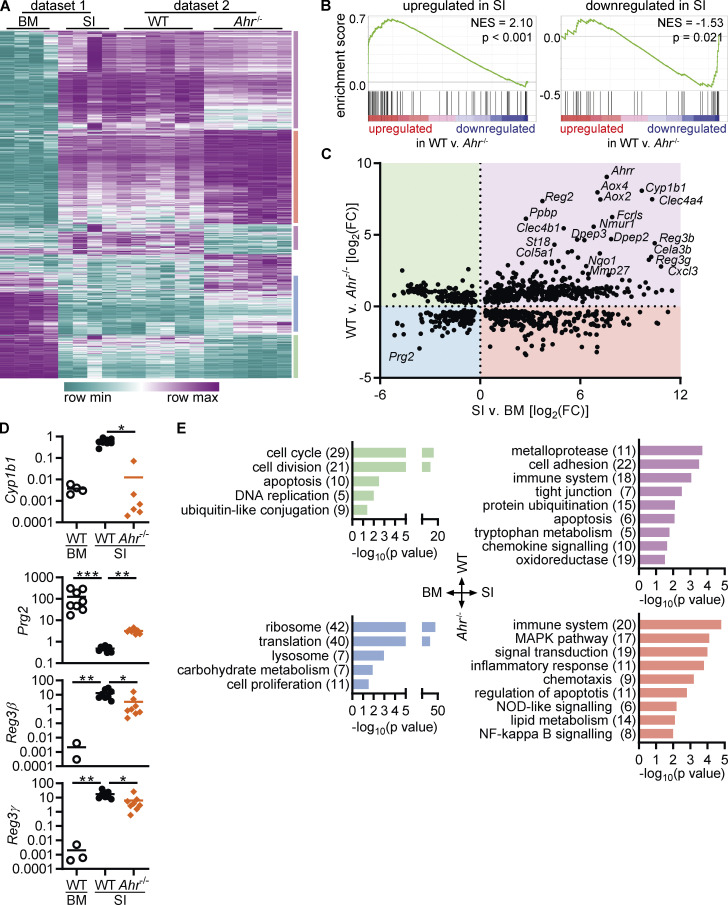
Intestinal tissue adaptation of eosinophils is partially controlled by AHR. (A) Hierarchical clustering of genes with differential expression in WT versus Ahr–/– eosinophils after normalization of dataset 1 to dataset 2. (B) Enrichment of the 100 most up- or downregulated genes from the comparison of intestinal versus bone marrow eosinophils in the dataset of WT versus Ahr–/– intestinal eosinophils. (C) Correlation of gene expression between the two RNA sequencing datasets. Only genes with differential expression in both datasets are shown. (D) Expression of selected genes was confirmed by qPCR in sorted eosinophils from BM and SI of different mice. Data are normalized to Hprt and are from n = 8 mice per group. Missing data points indicate that the gene was not detectable by qPCR. (E) Enriched pathways (P < 0.05) identified by DAVID based on differentially expressed genes (adjusted P value <0.05). Numbers in parentheses indicate the number of genes in each pathway. Subsets correspond to the four quadrants in C. *, P < 0.05; **, P < 0.01; ***, P, < 0.001; Kruskal-Wallis test with Dunn's correction for multiple comparison. BM, bone marrow; SI, small intestine.

