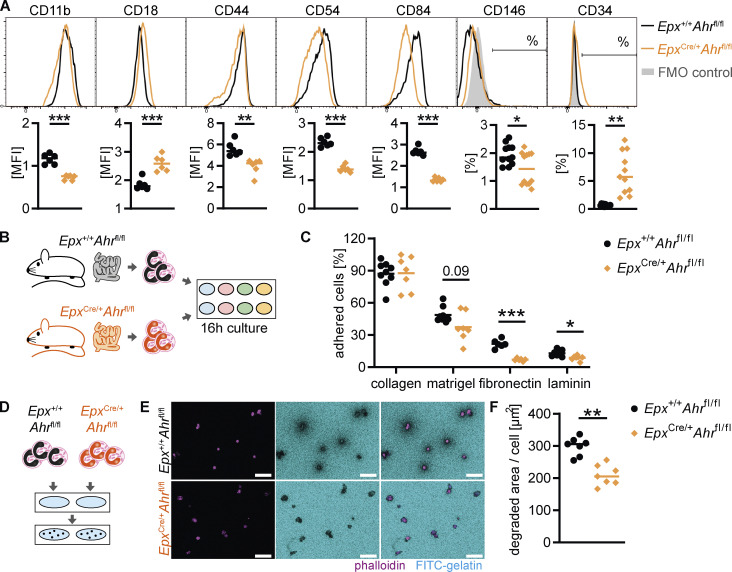
Figure 8.
AHR deficiency alters eosinophil–ECM interactions and remodeling. (A) Flow cytometry of cell adhesion molecules on small intestinal eosinophils pregated as live, CD45+CD11b+MHC-II–SiglecF+SSChi cells. Representative histograms and quantification are shown. Mean fluorescence intensity (MFI; arbitrary units) is shown for CD11b, CD18, CD44, CD54, and CD84. Data are representative of two independent experiments with n = 6 mice per genotype and were analyzed by t test. **, P < 0.01; ***, P < 0.001. Percentage of positive cells is shown for CD146 and CD34. Data are pooled from two independent experiments with n = 6 mice per genotype and were analyzed by t test. *, P < 0.05; **, P < 0.01. FMO, fluorescence minus one. (B and C) Eosinophils were FACS-sorted from the small intestine and seeded onto wells coated with different ECM components. After 16 h, nonadherent cells were washed away, and adherent cells were quantified. (C) Data are pooled from two independent experiments for n = 6–9 mice per genotype and were analyzed by t test followed by Holm–Sidak correction. *, P < 0.05; ***, P < 0.001. (D–F) Eosinophils were FACS-sorted from the small intestine and seeded onto FITC-gelatin–coated wells. Cells were cultured for 22 h, and the area of FITC-gelatin degradation was measured on fluorescent micrographs. (E) Representative images. Scale bar: 50 μm. (F) Data are pooled from two independent experiments for n = 7 mice per genotype and were analyzed by t test. **, P < 0.01. MFI, mean fluorescence intensity.

