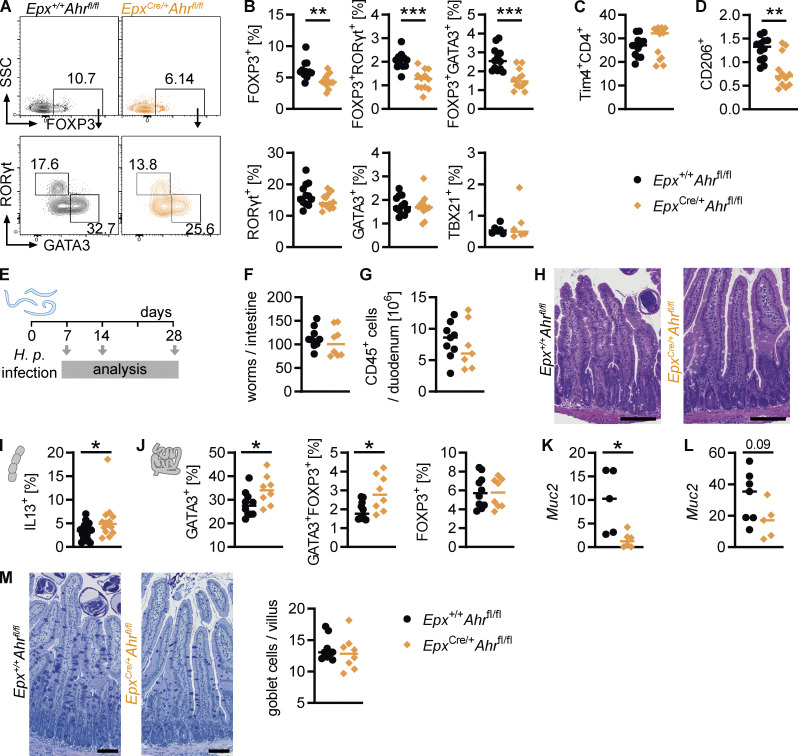
Figure 9.
AHR deficiency in eosinophils modulates the intestinal immune system. (A and B) Small intestinal CD45+CD3+CD4+TCRb+ T cells were analyzed by flow cytometry. (A) Representative flow cytometry plots. (B) Frequency of different T helper cell populations. (C and D) Flow cytometry of small intestinal macrophages (CD45+CD11b+CD64+MHC-II+). In A–D, data are pooled from two independent experiments for a total of n = 12 mice per genotype and were analyzed by t test. **, P < 0.01; ***, P < 0.001. (E–M) Epx+/+Ahrfl/fl and EpxCre/+Ahrfl/fl mice were infected with 200 H.p. L3 larvae on day 0 and analyzed 7, 14 or 28 d after infection. (F) Worm burden was quantified at day 14 after infection. (G) CD45+ cells in the duodenum were quantified by flow cytometry. (H) Representative images of H&E-stained duodenal sections from day 14 after infection. (I) Cytokine expression in CD4+ T cells from the mesenteric lymph node on day 14 after infection. (J) Transcription factor staining of lamina propria CD4+ T cells on day 14 after infection. (K and L) Gene expression was determined by qPCR and normalized to Hprt at day 7 (K) and day 14 (L) after infection. (M) Representative images and goblet cell quantification of AB-PAS–stained duodenal sections from day 14 after infection. *, P < 0.05; unpaired t test (I–L). In H and M, black scale bars: 0.1 mm.

