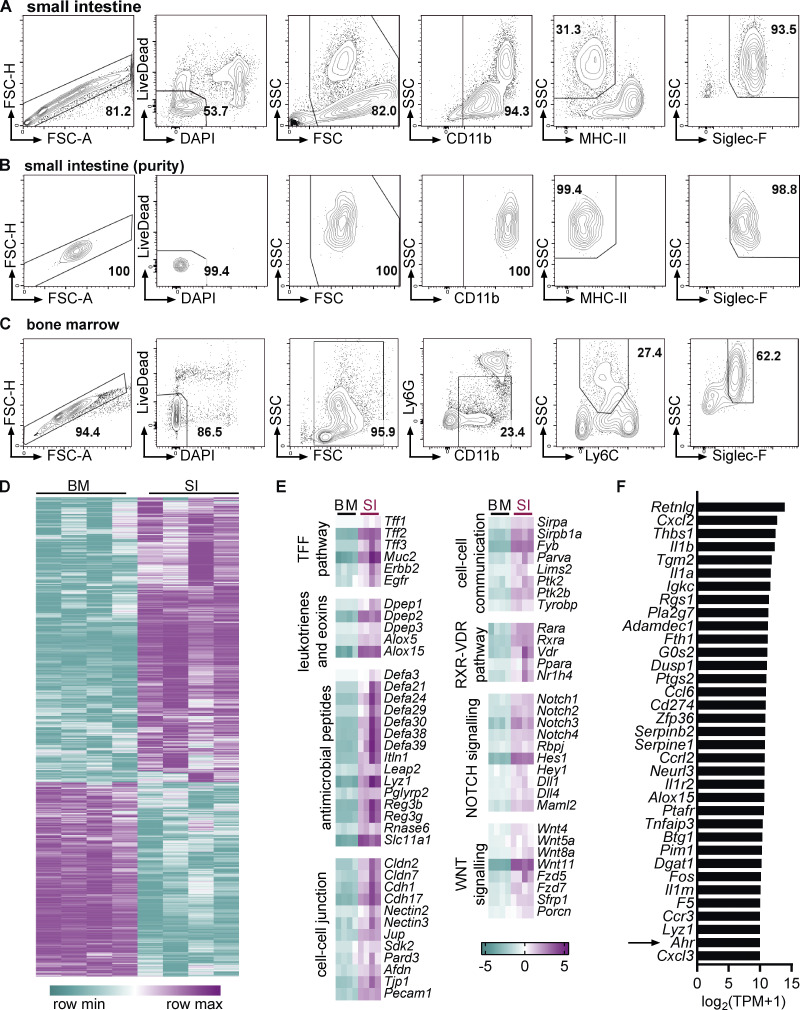
Figure S1.
Comparison of the eosinophil transcriptome between bone marrow and small intestine. (A–C) Representative flow cytometry plots depicting gating strategy for eosinophil sorting from SI (A and B) and bone marrow (C) for RNA sequencing. Intestinal cells were positively enriched with anti-CD11b microbeads before FACS sorting. (B) Representative flow cytometry plots depicting eosinophil purity after sorting. (D) Heatmap of differentially expressed genes. (E) Examples of functional groups of genes with positive enrichment in small intestinal eosinophils. Log2(FC) to geometric mean of TPM + 1 is shown. (F) Genes with highest absolute expression (TPM) in small intestinal eosinophils that were also differentially expressed compared with bone marrow eosinophils with a FC >10. BM, bone marrow; SI, small intestine; TPM, transcripts per million.

