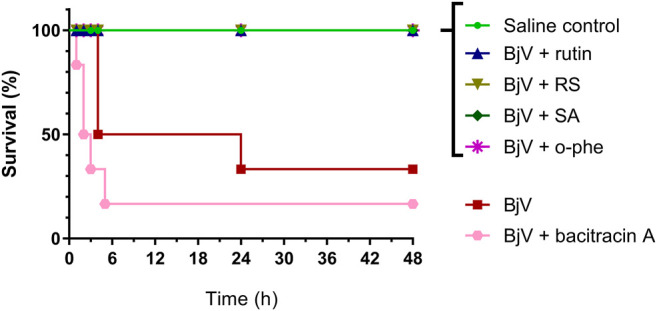
FIGURE 13.

Survival curves of mice during 48 h after the injection of saline, BjV, BjV + rutin, BjV + RS, BjV + SA, BjV + o-phe and BjV + bacitracin A (BjV dose: 3×LD50). Log-rank test was used, and survival curves showed significant difference (p = 0.005). Data were expressed as percentage of survival (n = 3–6/group).
