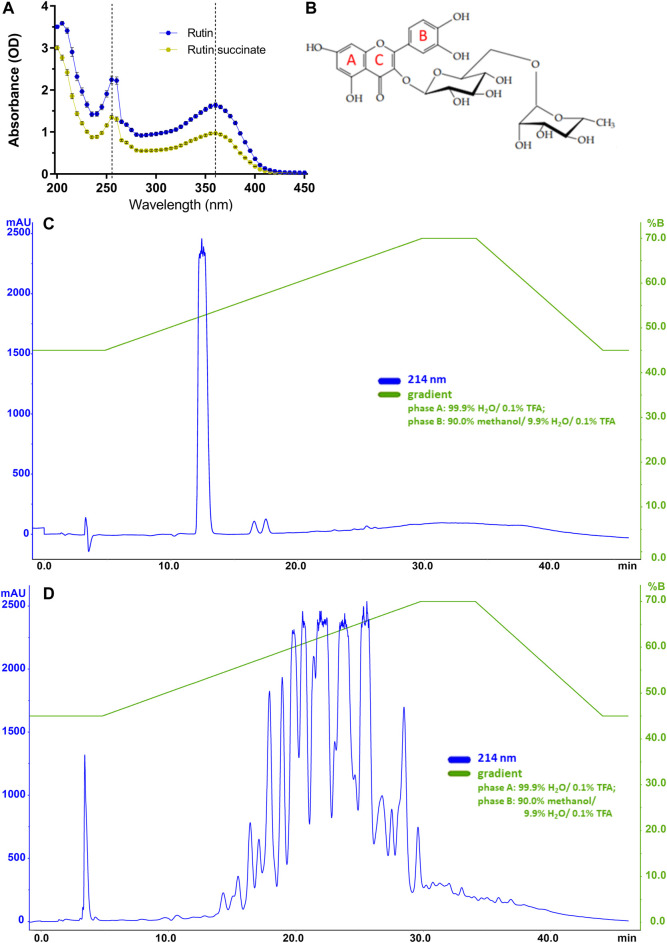
FIGURE 2.
(A) The absorbance spectra of rutin and RS. (B) Molecular structure of rutin with indications of aromatic rings A, B and C; Chromatographic profiles obtained for (C) rutin and (D) RS analyzed by HPLC using a C18 column (250 × 4.6 mm). Chromatographic conditions: ACE C18 column (250 × 4.6 mm); mobile phase A: 99.9% H2O/0.1% TFA and B: 90.0% methanol/9.9% H2O/0.1% TFA); flow rate of 1.0 ml/min; λ = 214 nm; and injection volume of 20 μl.

