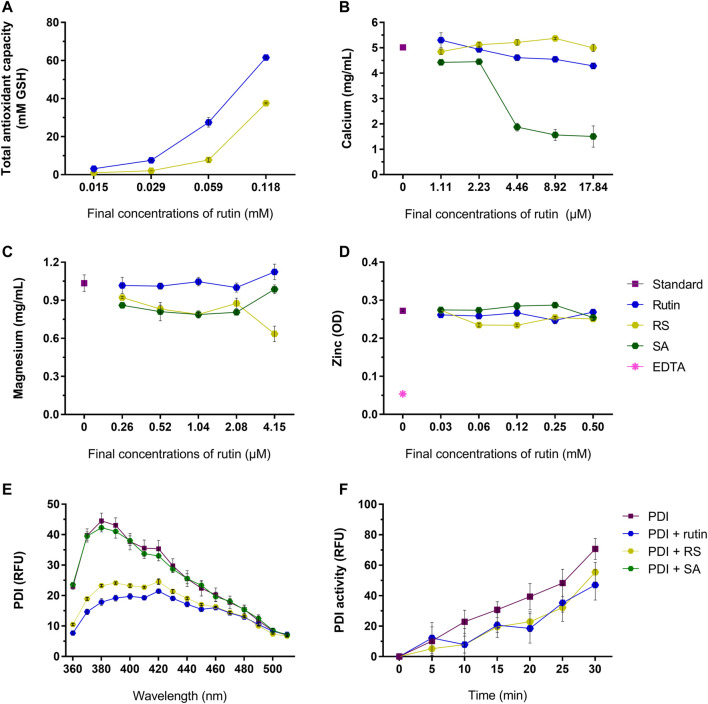
FIGURE 4.
(A) Total antioxidant capacity of rutin and RS at different concentrations, analyzed by the CUPRAC method. Data were expressed as GSH equivalents (mM). Quenching of (B) calcium, (C) magnesium and (D) zinc by the pre-incubation with rutin, RS, SA or Na2EDTA at different concentrations. Data were expressed as concentration of free calcium or magnesium (mg/ml) or as optical density units (OD) for zinc. (E) Fluorescence spectra of PDI or PDI pre-incubated with rutin, RS or AS. Data were expressed as relative fluorescence units (RFU). (F) PDI reductase activity, evaluated by change in the fluorescence of di-eosine-GSSG probe (150 nM); PDI was tested alone or PDI pre-incubated with rutin, RS and SA (60 µM). Data were expressed as relative fluorescence units (RFU). Assays for (A–D) were carried out in duplicate and for (E,F) in triplicate.

