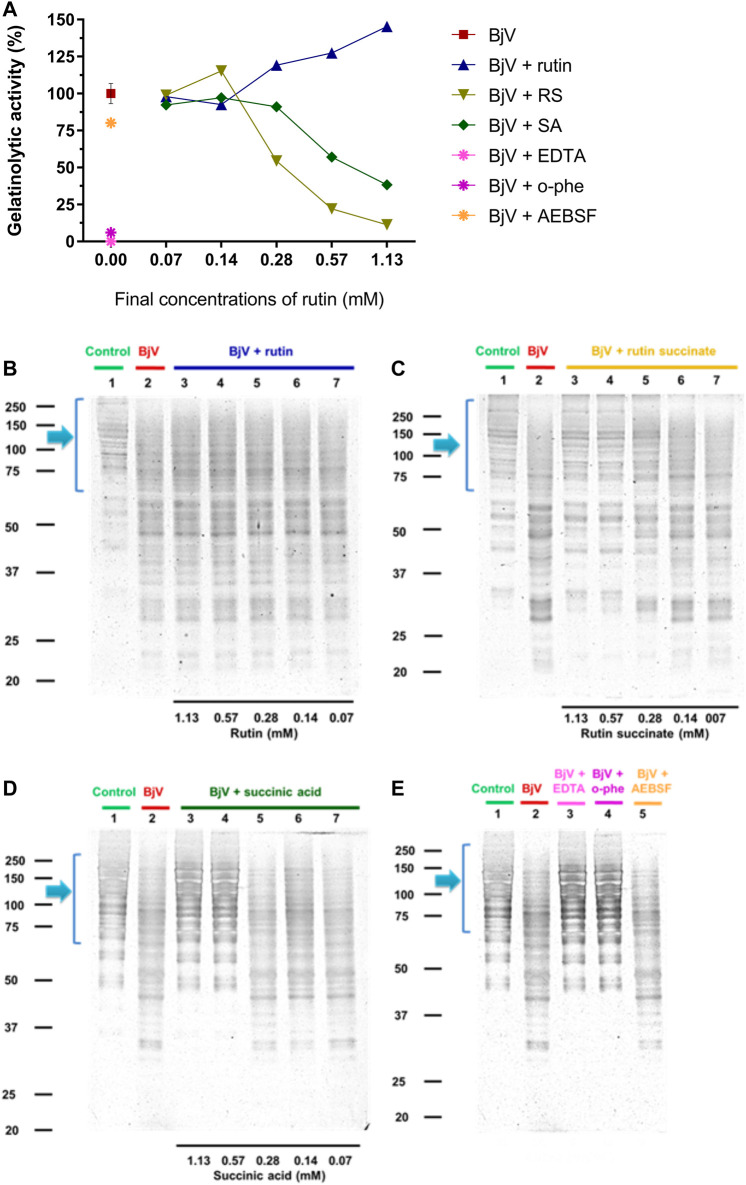
FIGURE 8.
(A–D) Activity of rutin, RS and SA at different concentration on BjV-induced gelatinolytic activity in vitro. (A) data were expressed as percentage of gelatinolytic activity induced by BjV alone; (B–E) gelatin degradation by BjV evaluated by means of SDS-PAGE gels (10%). Gelatin incubated without BjV (lanes 1) or with BjV solutions at 1.0 mg/ml (lanes 2); [(B), BjV + rutin], lanes 3–7, rutin concentrations ranging from 1.13 to 0.07 mM; [(C), BjV + RS], lanes 3–7, RS concentrations ranging from 1.13 to 0.07 mM; [(D), BjV + SA], lanes 3–7, SA concentrations ranging from 1.13 to 0.07 mM; (E) BjV + Na2EDTA (lane 3), BjV + o-phe (lane 4) and BjV + AEBSF (lane 5). Arrows refer to interest bands of 75 kDa–250 kDa, relative to non-degraded gelatin.

