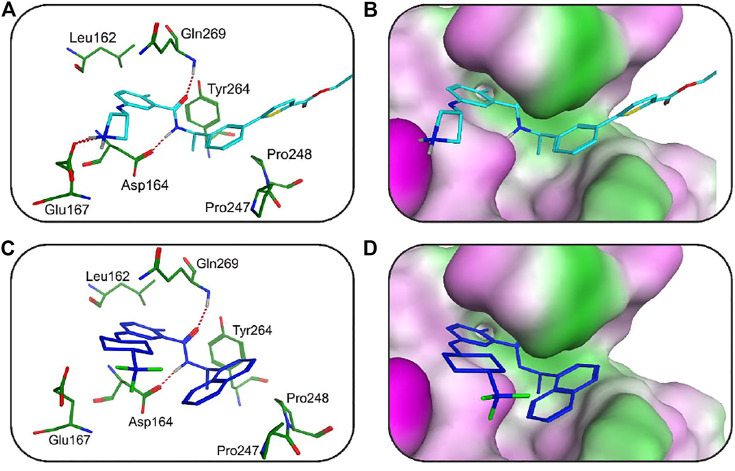
FIGURE 9.
(A) The 3D ligand–protein interaction diagram for the binding site of the SARS CoV-2 PLpro with hit 2. The active-site residues are shown in green stick form. Hit 2 is color-coded by cyan. The hydrogen-bond network with protein residues is represented by dotted lines. (B) Closeup stereo view of the structure of the PLpro-hit 2 complex. (C) The 3D ligand–protein interaction diagram for the binding site of the SARS CoV-2 PLpro with hit 4. Hit 4 is color-coded blue. The active-site residues are shown in green stick form. The hydrogen-bond interaction is represented in dotted lines. (D) Closeup stereo view of the structure of the PLpro-hit 4 complex.

