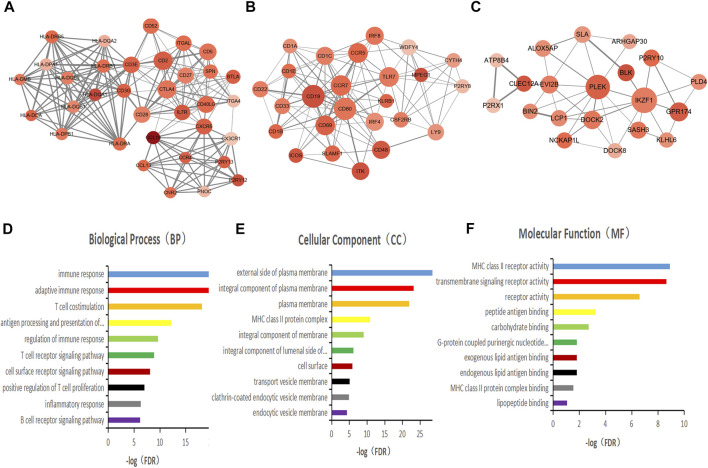
FIGURE 3.
PPI network was constructed to screen the key genes of immune function. (A–C) Interaction network constructed with the nodes with interaction confidence value > 0.5. The color of the nodes in the PPI network reflects the log(FC) value of the Z value of gene expression, and the size of the nodes represents the number of proteins interacting with the specified protein. (D–F) Top 10 GO terms of the mode gene in figure A. False discovery rate (FDR) of GO analysis was acquired from DAVID functional annotation tool, p < 0.05.

