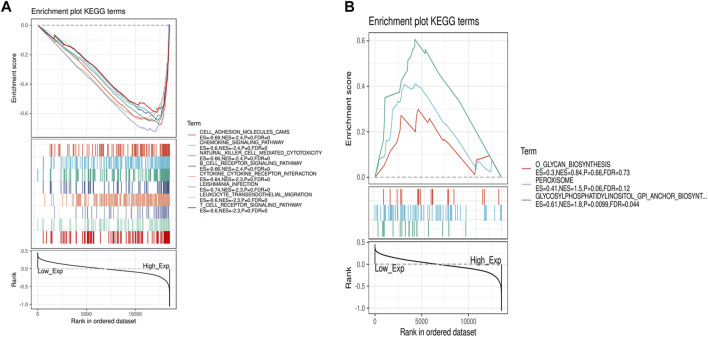
FIGURE 6.
GSEA for samples with high IL7R expression and low expression. (A) The enriched gene sets in HALLMARK collection by the high IL7R expression sample. Each line representing one particular gene set with unique color, p < 0.05 were considered significant. (B) The enriched gene sets in HALLMARK by samples with low IL7R expression, p < 0.05.

