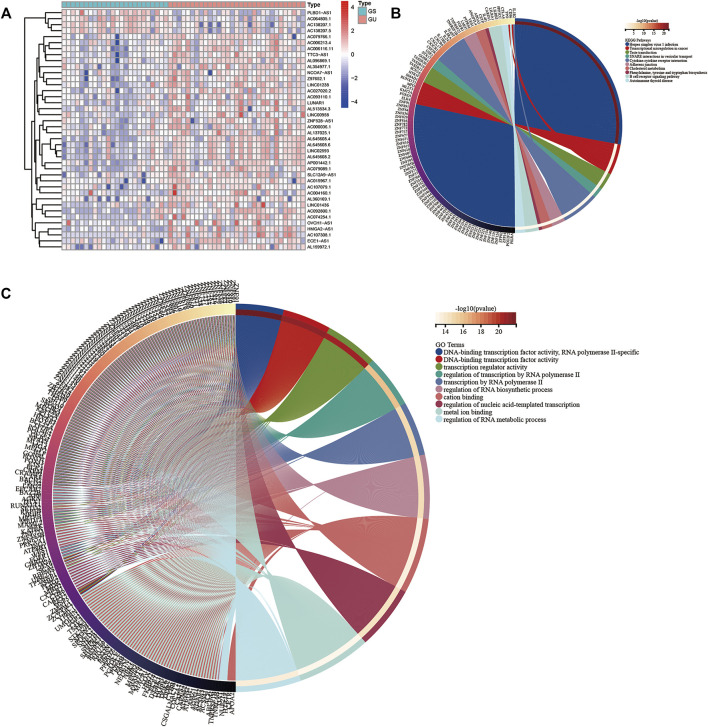
FIGURE 1.
(A) Heat map of the top 20 upregulated and downregulated lncRNAs. The upregulated and downregulated genes are marked red and blue, respectively. The top 10 mRNAs related to differentially expressed lncRNAs were selected as target genes. The Kyoto Encyclopedia of Genes (B) and Genomes and Gene Ontology (C) analysis maps of the target genes were drawn.

