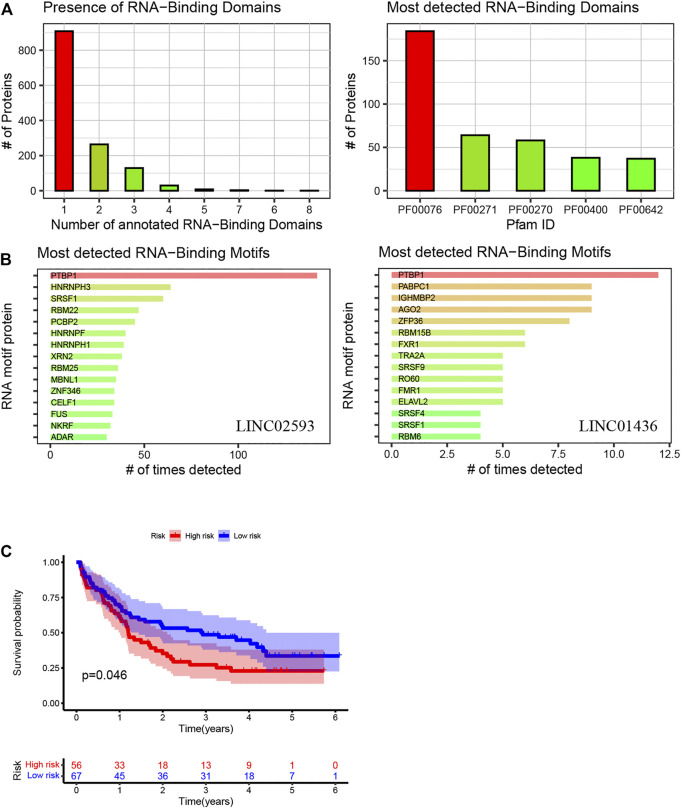
FIGURE 11.
Using the method of LNCipedia (Volders et al., 2019) and catRAPID (Armaos et al., 2021), transcripts are clustered into genes. (A,B) indicate the presence of protein nucleic-acid-binding domains or RNA recognition motifs in LINC01436 and LINC02593. (C) Kaplan–Meier curves of high- and low-risk groups in the validation cohort. The X- and Y-axes represent the time and probability of survival, whereas the red and blue lines represent the high- and low-risk groups, respectively.

