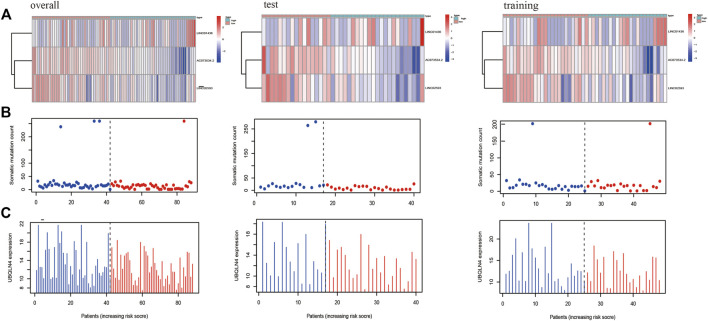
FIGURE 6.
The X-axes of A, B, and C are all samples sorted according to the increasing values at risk. (A) Heat map of the lncRNAs related to the prognostic model; the ordinate represents the three lncRNAs that make up the prognostic model. Red represents upregulation of gene expression, while blue represents downregulation of gene expression. (B) Distribution of gene mutation frequency; the ordinate represents the mutation frequency of each sample. (C) Expression frequency distribution of UBQLN4, the driver of genomic instability; the ordinate is the expression of UBQLN4 in each sample.

