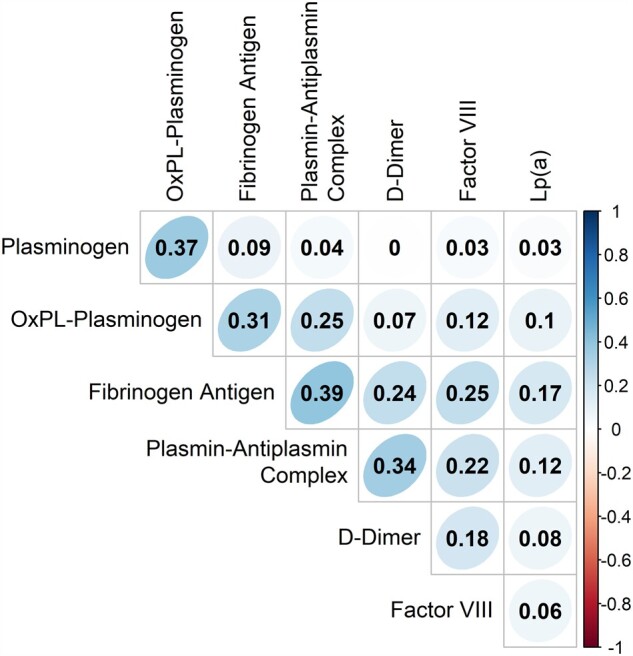
Figure 1.

Continuous variable associations of study atherothrombotic biomarkers. Values represent the Pearson correlation coefficient between log-transformed values of each biomarker. Graded colours are utilized to depict strength of linear association (red represents negative association; blue represents positive association). Bartlett’s test of sphericity provided evidence that the covariance matrix for the biomarkers differed from the identity matrix (P < 0.0001).
