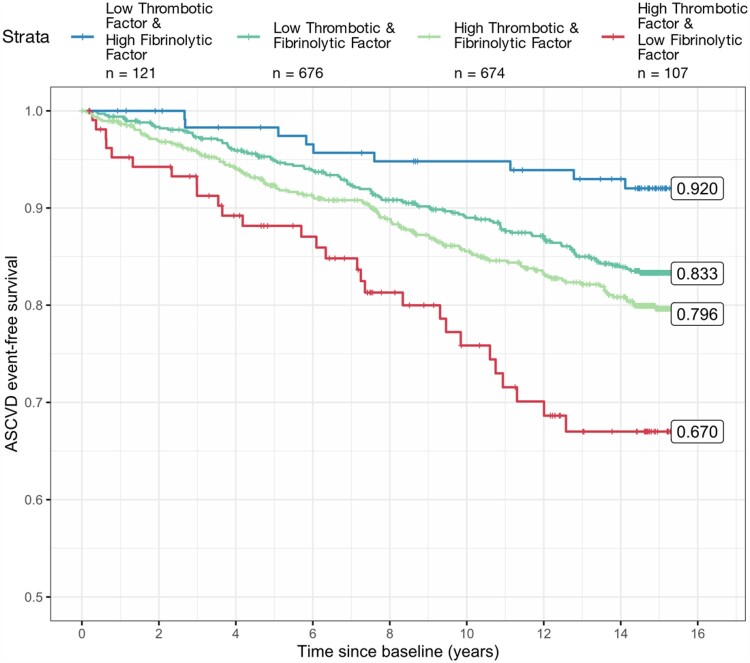
Figure 2.
Kaplan–Meier plot for participants with discordant levels of the factors (low thrombotic factor and high fibrinolytic factor; high thrombotic factor and low fibrinolytic factor), and two concordant levels (low thrombotic factor and low fibrinolytic factor; high thrombotic factor and high fibrinolytic factor).

