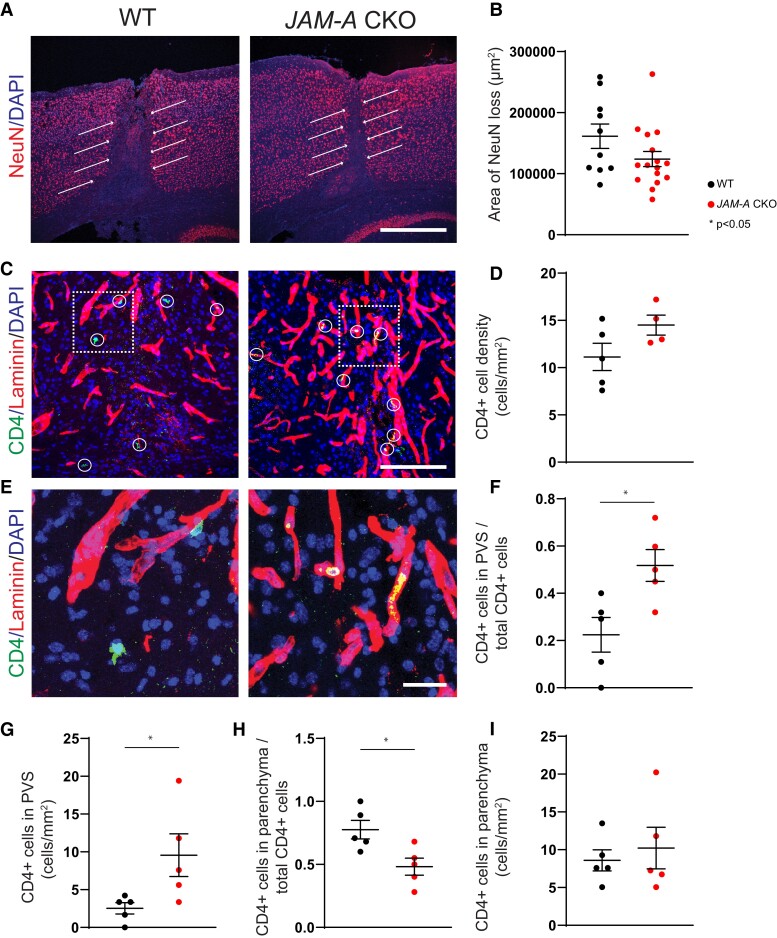
Figure 4.
In inflammatory cortical lesions, CD4+ T cells are arrested within the PVS in the absence of astrocytic JAM-A. Asymptomatic inflammatory cortical lesions were induced in JAM-A CKO and WT mice via the microinjection of AdIL-1 into the frontal cortex. Brains were harvested for histopathology at 7 days post-injection. (A and B) Lesions in JAM-A CKO mice, as measured by the area of neuronal cell death (loss of NeuN, red, white arrows), showed a trend in smaller lesion size compared with WT mice that did not reach statistical significance (P = 0.18, CKO n = 16 mice, WT n = 10 mice, Mann–Whitney test). (C and D) CD4+ cells (green and circled in white) showed an increased but statistically non-significant trend in number within JAM-A CKO lesions, scale bar: 125 μm [average number/mm2, 14.5 (CKO) versus 11.1 (WT), P = 0.11; CKO n = 4 mice, WT n = 5 mice, Mann–Whitney test]. (E–I) In JAM-A CKO mice, a higher proportion and total number of CD4+ cells (green) co-localize to the laminin-positive (red) basement membrane of the PVS while a lower proportion of cells localize to the parenchyma (laminin-negative) though total number of cells within the parenchyma per area remain the same. (E) Scale bar: 25 μm. (F) Average proportion of CD4+ cells in the PVS over total CD4+ cells: 0.50 (CKO) versus 0.29 (WT), P = 0.02. (G) Average number CD4+ cells in the PVS/mm2: 7.6 (CKO) versus 3.4 (WT), P = 0.03. (H) Average proportion of CD4+ cells in the parenchyma over total CD4+ cells: 0.50 (CKO) versus 0.70 (WT), P = 0.02. (I) Average number CD4+ cells in the PVS/mm2: 7.2 (CKO) versus 7.6 (WT), P = 0.85. (F–I) N = 5 mice per group, Mann–Whitney tests.

