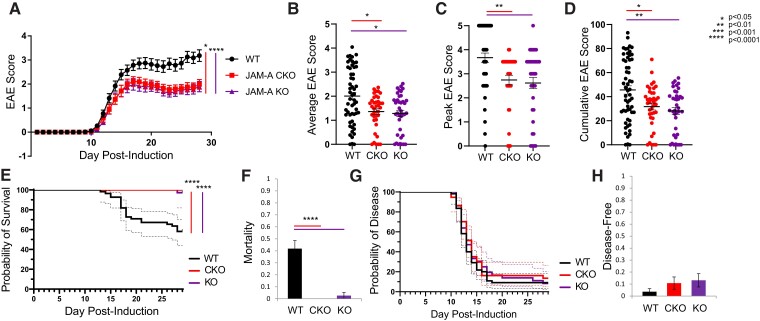
Figure 5.
Astrocytic JAM-A promotes clinical disease severity during EAE. (A) JAM-A CKO and KO mice showed a milder course of clinical disability than WT mice with EAE and there was no difference between CKO and KO animals (WT versus JAM-A CKO: P = 0.0122, WT versus JAM-A KO: P < 0.0001, JAM-A CKO versus JAM-A KO: P > 0.05, Friedman’s one-way ANOVA with Dunn’s multiple comparisons test). (B–D) Average (B), peak (C) and cumulative (D) scores of the EAE trial shown in (A) were significantly lower in CKO and KO mice compared with WT [average score: 2.0 (WT) versus 1.36 (CKO) versus 1.28 (KO), WT versus CKO: P = 0.030, WT versus KO: P = 0.016, CKO versus KO: P > 0.5; peak score: 3.6 (WT) versus 2.7 (CKO) versus 2.6 (KO), WT versus CKO: P = 0.003, WT versus KO: P = 0.002, CKO versus KO: P > 0.5; cumulative score: 45.58 (WT) versus 31.75 (CKO) versus 28.2 (KO), WT versus CKO: P = 0.04, WT versus KO: P = 0.007, CKO versus KO: P > 0.5, Kruskal–Wallis tests]. Average in graphs shown with SEM. (E) Survival curves of mortality revealed that WT mice sustained greater mortality over the course of EAE than CKO or KO, Mantel–Cox test, P < 0.0001. (F) At Day 28, mortality rate was higher in WT mice compared with CKO and KO [0.41 (WT) versus 0 (CKO) versus 0.26 (KO), P < 0.0001, Kruskal–Wallis test]. (G) Disease curves demonstrated no differences in susceptibility to or timing of disease, Mantel–Cox test, P = 0.65. (H) At Day 28, rates of disease resistance (proportion of mice that did not develop neurological deficit) showed an increased trend that was not statistically significant for CKO and KO compared with WT [0.014 (WT) versus 0.108 (CKO) versus 0.131 (KO), P = 0.22, Kruskal–Wallis test]. Graphs (A–H) show pooled data from three independent EAE experiments for WT and CKO and two independent EAE experiments for KO with a minimum of nine mice per group in each experiment, total WT n = 55, JAM-A CKO n = 37, JAM-A KO n = 38.

