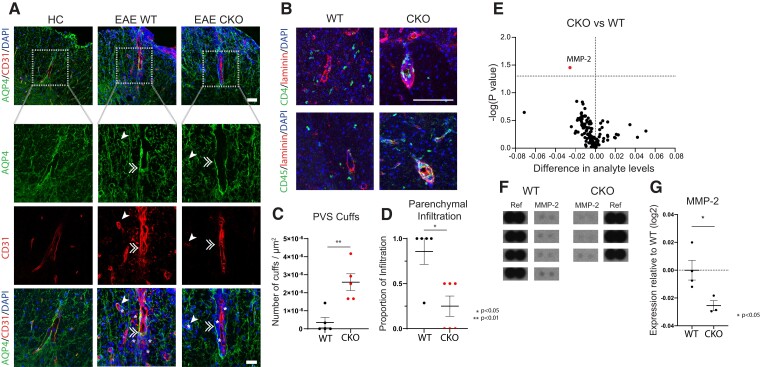
Figure 7.
In EAE, astrocytic JAM-A signalling induces MMP-2 expression and promotes T-lymphocyte entry into the CNS parenchyma from the PVSs. (A) PVSs were identified relative to AQP4 staining of the astrocyte endfeet and CD31 staining of the endothelium in HC, WT and CKO mice. Cell infiltrates (DAPI, blue) were seen in the CNS at 5 days post-EAE disease onset in both WT and CKO but not in HC. Representative images demonstrate that in JAM-A CKO, infiltrating cells (highlighted by white asterisks) accumulated mostly within the PVSs (between AQP4 and CD31) whereas in WT, infiltrating cells localized diffusely past the PVSs within the CNS parenchyma. White single arrowheads and white doubled arrowheads indicate transverse and longitudinal blood vessels, respectively. Top panel, scale bar: 50 µm. Bottom panels represent inset outlined by dotted white box, scale bar: 30 µm. (B) In inflammatory lesions of EAE at Day 21 post-immunization, in CKO mice, CD4+ (green, upper panel) and CD45+ cells (green, lower panel) clustered in ‘cuffs’, colocalizing with the pan-laminin marker (in red), whereas in WT mice, CD4+ and CD45+ cells were instead located in the parenchyma. Scale bar: 100 µm. (C) Number of CD4+ cuffs/µm2 of lumbar spinal cord cross-sections were increased in JAM-A CKO mice compared with WTs [average 3.5 × 10⁻⁷ (WT) versus 2.6 × 10⁻⁶ (CKO), P = 0.008, Mann–Whitney test, number of mice: WT n = 5, CKO n = 5]. (D) Proportion of parenchymal infiltration of CD4+ cells seen in serial spinal cord sections was lower in JAM-A CKO compared with WT mice [average 0.86 (WT) versus 0.25 (CKO), P = 0.02, Mann–Whitney test, WT n = 5, CKO n = 6]. (E) A volcano plot shows the differential level of 111 pro-inflammatory cytokines, chemokines, proteases and acute phase reactants in spinal cord lysates of JAM-A CKO and WT mice at 5 days post-EAE disease onset as measured using mouse proteome ELISA immunoassays. CKO mice showed an overall reduction of many factors, though MMP-2 (highlighted in red) was the sole statistically significant factor compared with WT controls. (F) MMP-2 probes on the ELISA array in CKO and WT mice, along with reference spots, used for signal (pixel intensity) normalization, are shown. Complete ELISA arrays from each mouse are shown in Supplementary Fig. 6 and original blots are included in Supplementary Materials. (G) Spinal cord levels of MMP-2 in CKO mice relative to WT controls were significantly decreased at 5 days post-EAE disease onset (relative log2 expression −0.025, P = 0.0351, two-tailed unpaired t-test, WT, n = 4; CKO, n = 3).

