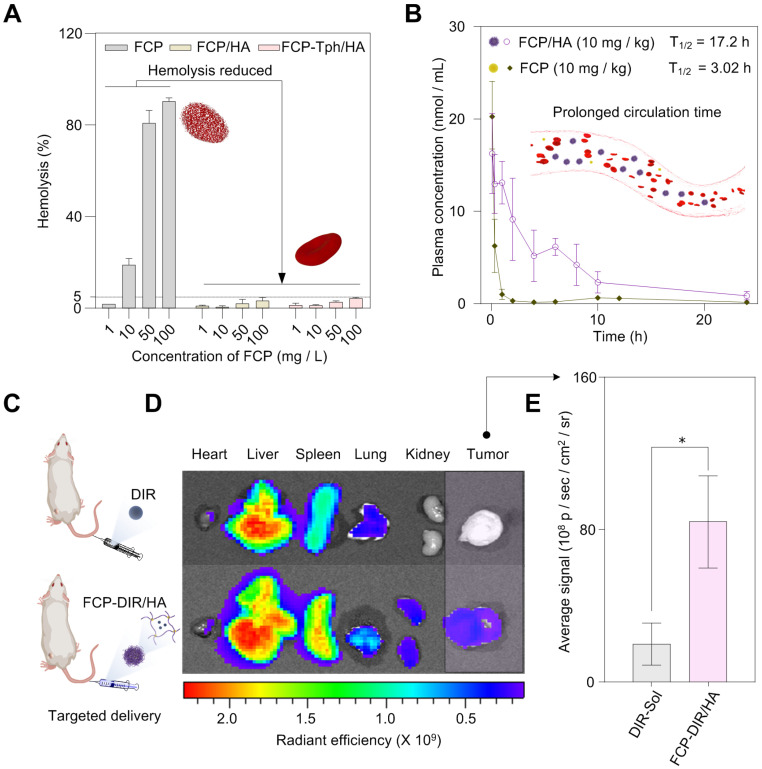
Figure 4.
In vivo studies of the micelles. A) The formation of nanomicelle weaken the hemolysis rate of FCP. B) FCP/HA extended the blood circulation time of FCP in vivo (n = 6). C) In vivo biodistribution of FCP-DIR/HA (n = 3). D) Fluorescent images at 24 h after drug injection; E) Quantitative results of relative organ and tumor accumulation at 24 h (n = 3). All values are presented as the mean ± SD. (*) p < 0.05 compared with DIR-Sol.

