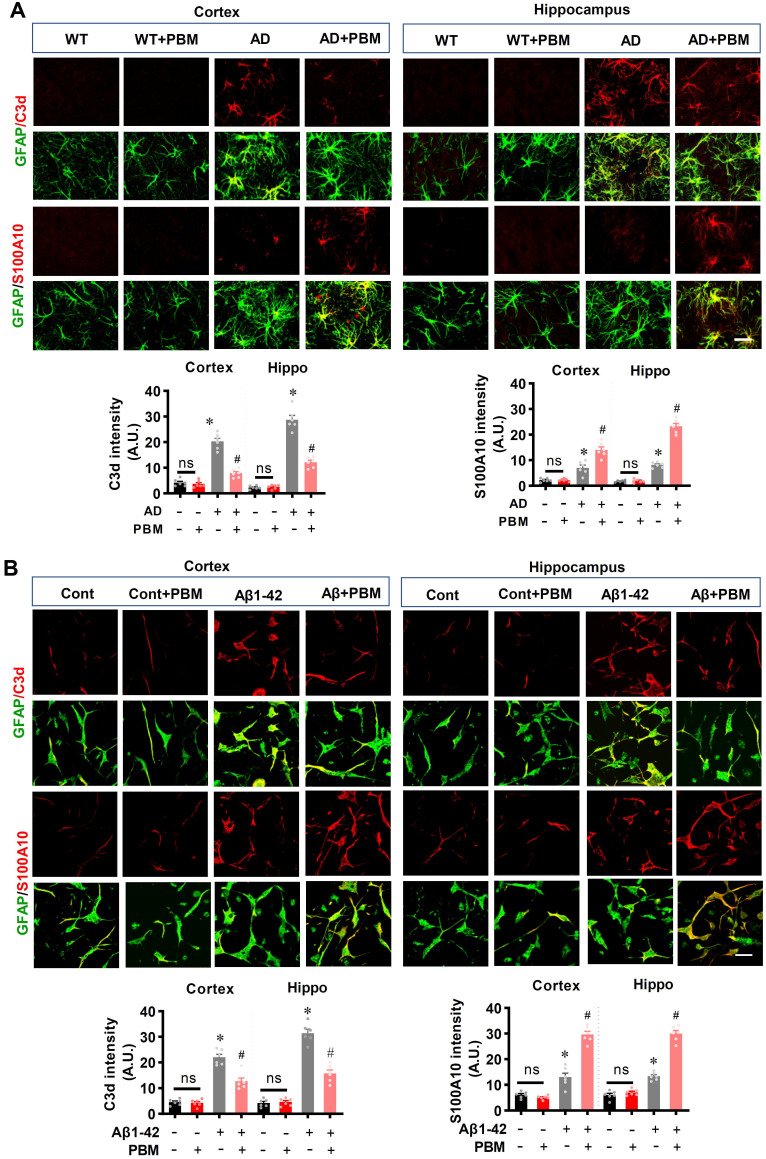
Figure 7.
PBM treatment promotes astrocytic polarization from A1 to A2 phenotype. (A) Representative confocal microscopy images of GFAP (green) with A1 marker C3d or the A2 marker S100A10 in both the cortex and hippocampus. The relative fluorescent intensities of C3d and S100A10 were analyzed using Image J. (B) Representative confocal microscopy images of GFAP with C3d or S100A10 in vitro cell culture. Scale bar = 20 µm. Data are presented as mean ± SEM (n = 6). *P < 0.05 versus WT group, # P < 0.05 versus AD or Aβ1-42 group. ns indicates no significant difference (P > 0.05).

