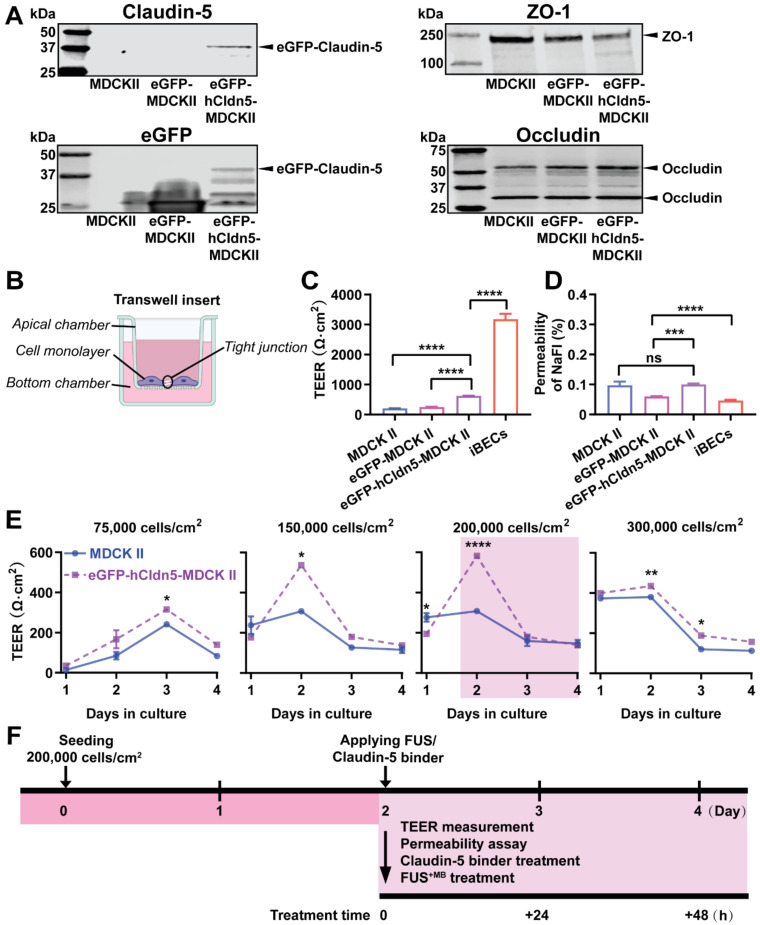
Figure 2.
eGFP-hCldn5-MDCK II cells exhibit a tight monolayer as determined by TEER and cargo leakage. (A) Western blotting with either a claudin-5 or GFP antibody reveals expression of the eGFP-hClaudin5 fusion protein in eGFP-hCldn5-MDCK II but not eGFP-MDCK II cells. Expression of the tight junction proteins ZO-1 and occludin is also shown. (B) Scheme of Transwell insert to measure TEER and permeability. (C) eGFP-hCldn5-MDCK II cells display a four-fold higher TEER than MDCK II cells. iBEC cells are included for comparison. (D) All three MDCK II cell lines show a < 0.2% permeability for sodium fluorescein (NaFl), indicating a tight BBB. (E) TEER of eGFP-hCldn5-MDCK II and MDCK II cells shown as a function of cell density and days in culture. Asterisks refer to TEER differences between eGFP-hCldn5-MDCK II and MDCK II for a given time point. TEER values are shown as Ω·cm2 and results are expressed as mean ± SEM. N>10 per condition. (F) Schematic illustration of the experimental workflow. Statistical significance was determined as unpaired Student's t-test (*p<0.05, **p<0.01, ***p<0.001 and ****P<0.0001).

